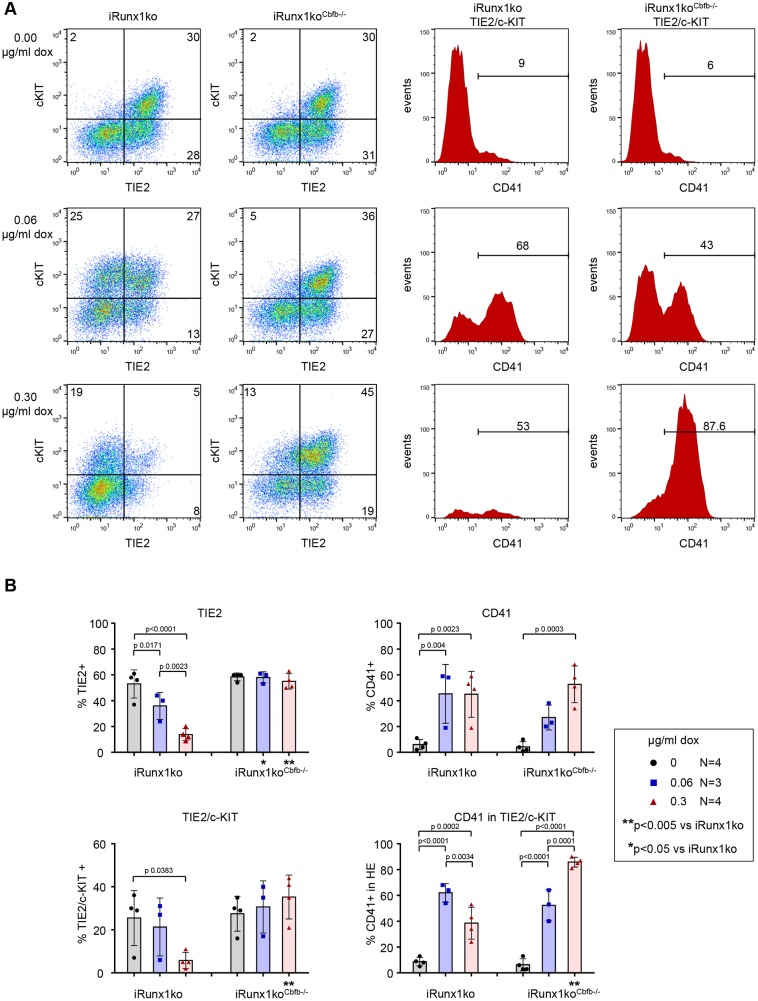
Fig. 5.
Low RUNX1 levels can induce EHT-like changes. (A,B) Representative flow cytometry plots (A) and flow cytometry data (B) of day 3 iRunx1ko and iRunx1koCbfb−/− EHT cultures. (A) Left: HE (TIE2+/c-KIT+). Right: TIE2+/c-KIT+ gated histograms depicting the percentage CD41+ cells within HE. Horizontal bars indicate the CD41+ population. (B) Individual biological experiments and mean±s.d. are shown. Two-way ANOVA. N=biological replicates.

