Fig. 5.

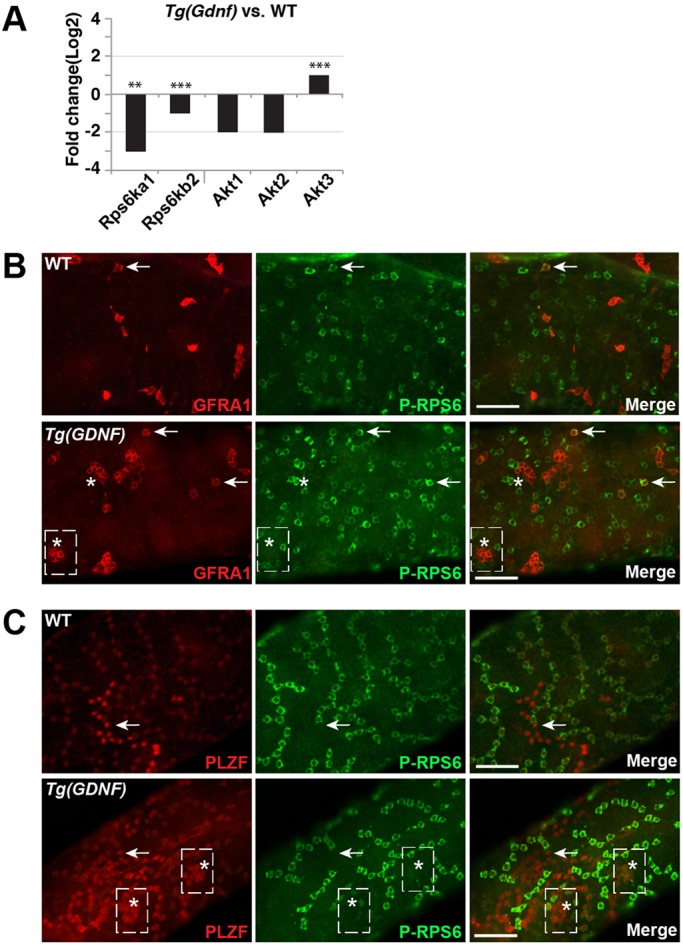
mTORC1 signaling is not activated in Tg(Gdnf) GFRA1+ PLZF+ clusters. (A) Transcript fold-change in read counts per million using RNA-seq on extracts from 4-month-old testis. Shown is the change in Tg(Gdnf) compared with wild type. (B) Whole-mount tubules stained for GFRA1 and phosphorylated RPS6, an indicator of mTORC1 activation. Arrows indicate GFRA+ P-RPS6+ spermatogonia. Asterisks indicate Tg(Gdnf) clusters that do not label for P-RPS6. (C) Whole-mount tubules stained for PLZF and phosphorylated RPS6. Arrows indicate PLZF+ Aal cells that do not label for P-RPS6. The boxes indicate clusters. The asterisks indicate cells within the clusters that do not label for P-RPS6. See also Fig. S4. Scale bars: 100 µm.
