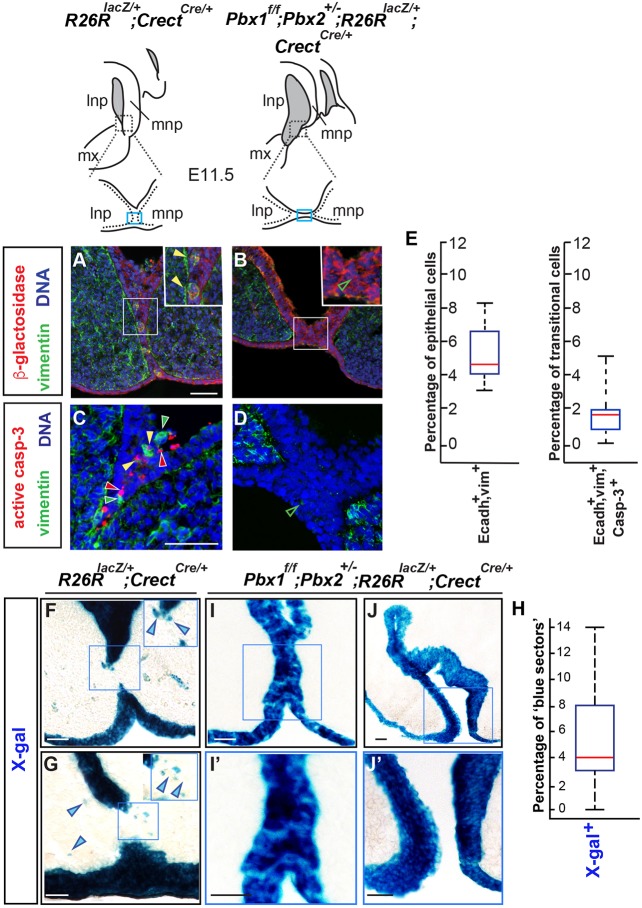
Fig. 2.
Detection and quantitation of transitional cells at the λ of controls and Pbx1/2 mutant embryos together with fate mapping and quantitation of epithelial cells. Top: λ sketches of E11.5 embryos of the indicated genotypes for control reporter (left) and Pbx1/2 mutant (right). Fusion site at the λ is indicated by blue rectangles. (A-D) Immunofluorescence of coronal sections of control and mutant λ with Abs for β-galactosidase (red; A,B and insets), vimentin (green; A-D) and active caspase 3 (red; C,D); DAPI labels nuclei (blue). (A,B) β-galactosidase-positive cells of epithelial derivation. In control (A), seam epithelium β-galactosidase-positive cells express vimentin (filled yellow arrowheads; inset). Negligible numbers of vimentin-positive cells are observed in the mutant (unfilled green arrowheads; B,D). (C) In control λ epithelium, a few cells are either vimentin positive, or active caspase 3 positive, or double positive (filled green, red and yellow arrowheads, respectively). (E) Box-and-whisker plots represent transitional cells expressing E-cadherin (Ecadh+) and vimentin (vim+) over total number of epithelial cells (left) and transitional cells that are also active caspase 3 positive (right). (F-H) Lineage tracing and quantitation (illustrated in box-and-whisker plot; H) of epithelial and epithelial-derived cells (blue) in control (F,G) and Pbx1/2 mutant (I-J′) λ. Scale bars: 50 µm (A-D); 100 µm (F-J′).

