Fig. 1.
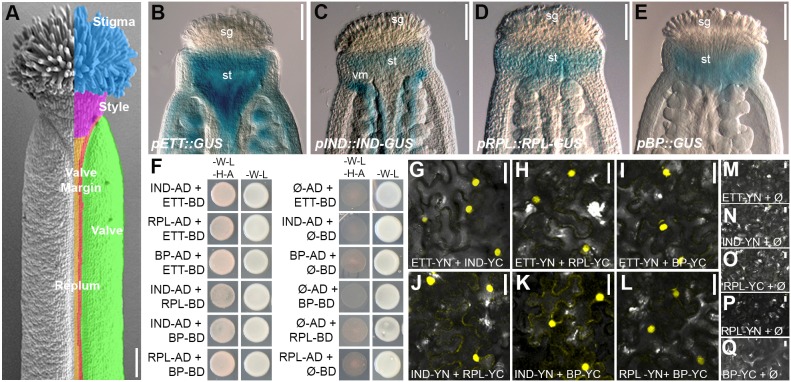
Overlapping expression pattern of genes encoding ETT-interacting TFs. (A) SEM image of wild-type mature gynoecium (stage 13). Tissues are colour-coded: cyan, stigma; pink, style; green, valves; red, valve margin; orange, replum. (B-E) GUS staining of pETT(8kb)::GUS (B), pIND::IND-GUS (C), pRPL::RPL-GUS (D) and pBP::GUS (E) marker lines showing overlapping expression patterns at the gynoecium apex at stage 11. (F) Y2H assay showing interactions between ETT, IND, RPL and BP (selective medium -W-L-H-A, left columns) and respective controls (permissive -W-L, right columns). (G-Q) BiFC assays between ETT, IND, RPL and BP in tobacco leaf epidermis cells (G-L) and respective controls (M-Q). sg, stigma; st, style; vm, valve margin. Scale bars: 100 µm in A-E, 20 µm in G-Q.

