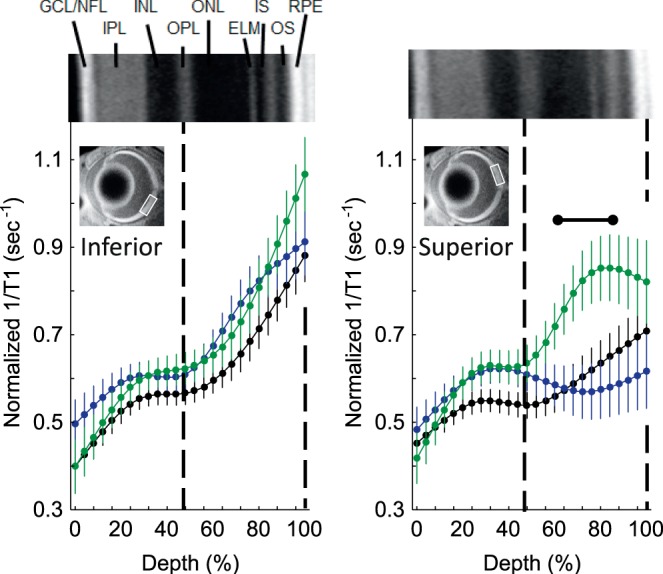
Figure 1.

Excessive free radical production in male dark-reared P23 mice retina. Modeling results of normalized 1/T1 MRI profiles in vivo for central retina on either the inferior (left) or superior (right) side (indicated by the box in the MRI insert of each graph; see Methods for details) for the following groups: dark-reared P23 wt group (black, n = 7), dark-reared P23 Pde6brd10 mice injected with saline (green, n = 5), and dark-reared P23 Pde6brd10 mice injected with MB (blue, n = 7). Representative dark-reared P23 Pde6brd10 mice OCT image (above profiles) illustrates laminar spacing (OCTs are not different between groups; Fig. 4); layer assignments (GCL, ganglion cell layer; INL, inner nuclear layer; IPL, inner plexiform layer; IS, rod inner segment layer; OLM, outer limiting membrane; ONL, outer nuclear layer; OPL, outer plexiform layer; OS, rod outer segment layer) are as previously published.44 Dashed vertical lines map OPL and retina-choroid boundary onto MRI profiles (below). Range bar: region showing a significant (P < 0.05) positive QUEST MRI response, indicative of oxidative stress (i.e., 1/T1 that is greater-than-normal with a saline injection and significantly reduced with a MB injection). Each 1/T1 data set was normalized to its TR 150-millisecond image (“Normalized 1/T1”; Methods section).
