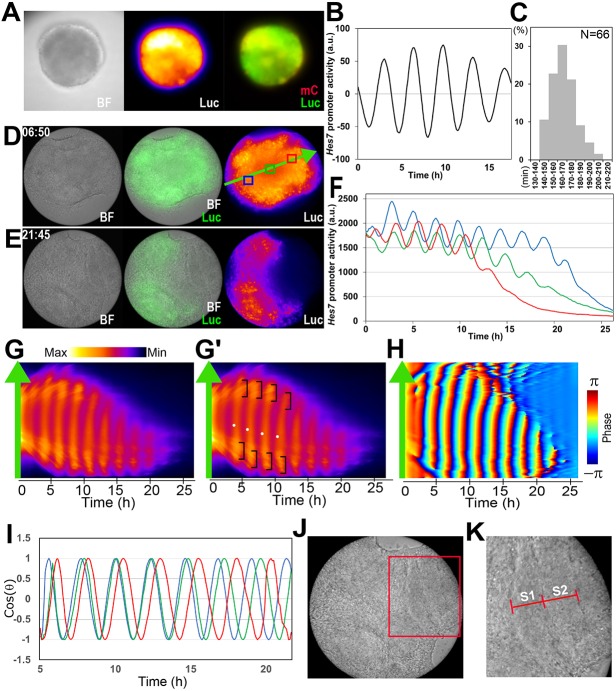
Fig. 3.
Live imaging of Hes7 expression in a single iPSM colony. iPSM colonies were cultured in either gelatin-coated (A-C, n=8) or fibronectin-coated (D-K, n=13) dishes. (A) Bright-field (BF) and live imaging of Hes7 promoter-driven luciferase activity (Luc) in an iPSM colony. mCherry (mC) was expressed under the control of Msgn1 promoter. (B) Detrended luciferase activity in an iPSM colony. All samples (n=8) showed similar oscillatory patterns. (C) The period distribution of Hes7 oscillations in iPSM colonies. (D,E) Bright-field (BF) and live imaging of luciferase activity (Luc) in an iPSM colony at different time points in culture starting from day 4. (F) Intensity of Hes7 promoter-driven luciferase activity in an iPSM colony. Blue, green and red lines indicate the intensity measured in blue, green and red boxes, respectively, in D. (G,G′) Kymograph of Hes7 promoter-driven luciferase activity measured along the green arrow shown in D. Hes7 waves started from the center of this focus (dots in G′), propagated peripherally, and increased in intensity near the end (brackets in G′). (H) Oscillation phase of Hes7 promoter-driven luciferase activity in G was calculated. (I) Blue, green and red lines indicate the oscillation phase measured in blue, green and red boxes, respectively, in D. All samples (n=13) showed similar oscillatory patterns. (J) Bright-field image of an iPSM colony showing segment formation (boxed). (K) Boxed region in J is enlarged. S1 and S2 indicate a newly formed segment and the one formed before S1, respectively (see also Fig. S4).

