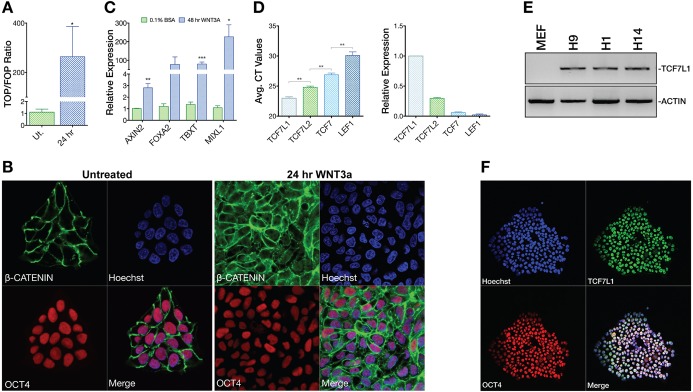
Fig. 1.
Inactive WNT signaling and TCF/LEF expression in hESCs. (A) TOPflash WNT signaling reporter analysis (n=3) of undifferentiated (Ut.) H9 hESCs or those treated with WNT3A (100 ng/ml) for 24 h. One-tailed t-test, *P≤0.05. Error bars indicate s.e.m. (B) Confocal analysis of OCT4 and β-catenin localization in untreated (mTeSR1) or 24 h WNT3A (100 ng/ml) stimulated conditions. (C) qPCR analysis (n=3) shows that WNT3A induces primitive streak (PS) gene expression after 48 h. T, brachyury. Two-tailed t-test, *P≤0.05, **P≤0.01, ***P≤0.001. (D) Averaged Ct values from LEF/TCF qPCR analysis in H9 hESCs (left) and normalized comparative analysis of LEF/TCF qPCR data showing LEF/TCF mRNA levels relative to TCF7L1 (n=3). Two-tailed t-test, **P≤0.01. (E) PCR analysis of TCF7L1 mRNA expression levels in H1, H9 and H14 hESCs. MEF-only sample illustrates species specificity of the TCF7L1 primers. β-actin was the template loading control. (F) Confocal immunofluorescence analysis of OCT4 and TCF7L1 in H9 hESCs under feeder-free conditions.

