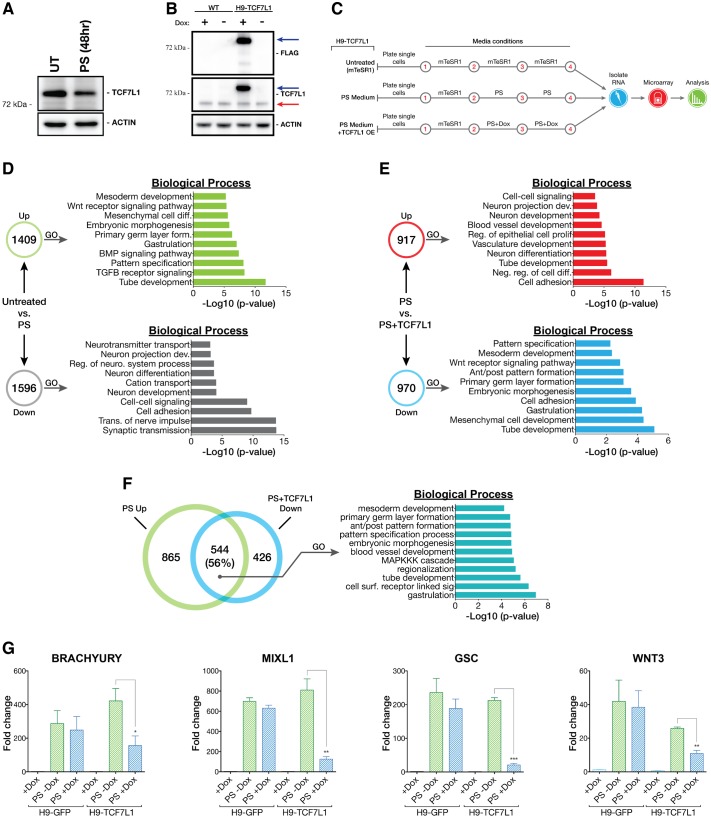
Fig. 5.
TCF7L1 overexpression impedes PS differentiation. (A) Western blot analysis of TCF7L1 protein after 48 h of PS differentiation as compared with untreated control (UT). (B) FLAG-TCF7L1-HTBH is robustly overexpressed in H9-TCF7L1 cells after 48 h of doxycycline (1 μg/ml) induction. The higher molecular weight band is FLAG-TCF7L1-HTBH (blue arrow). The lower band is endogenous TCF7L1 (red arrow). WT, H9 cells. (C) Scheme of the TCF7L1 overexpression microarray experiment. (D) Comparison of PS differentiated H9-TCF7L1 cells (without doxycycline induction) with mTeSR1-cultured H9-TCF7L1 cells (untreated). GO analysis of significantly differentially expressed genes is shown as –log10 of their respective P-values. (E) Comparison of PS differentiated H9-TCF7L1 cells with and without 48 h of doxycycline induction. GO analysis of significantly differentially expressed genes is presented as –log10 of their respective P-values. (F) GO analysis of shared PS+TCF7L1 downregulated versus PS upregulated genes, indicating enrichment of genes involved in gastrulation, embryonic patterning and embryonic morphogenesis. (G) qPCR validation of candidate TCF7L1-repressed genes identified by microarray analysis. Analysis was performed with H9-TCF7L1 and control H9-GFP cell lines (n=3). Two-tailed t-test, *P≤0.05, **P≤0.01, ***P≤0.001. Error bars indicate s.e.m. Ant/post, anterior/posterior; dev., development; diff., differentiation; form., formation; reg., regulation; neuro., neurological; neg., negative; surf., surface; sig., signaling.

