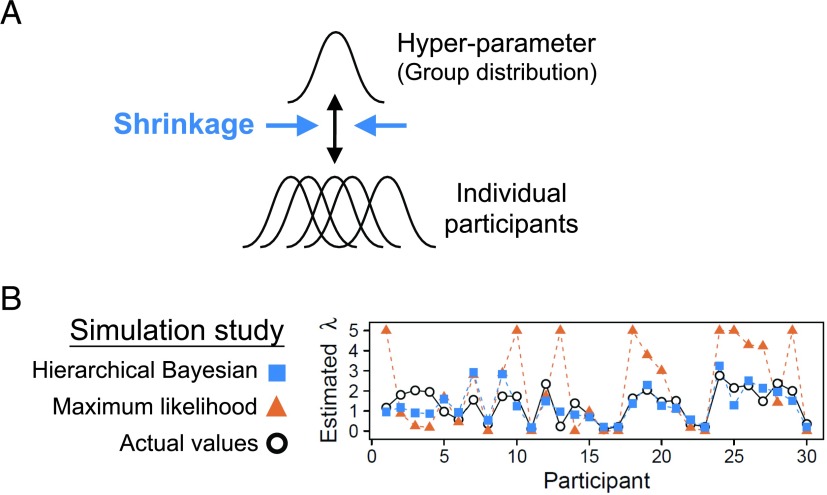
Figure 2. .
(A) A schematic illustration of hierarchical Bayesian analysis (HBA). In this example, the individual parameters are assumed to come from a group (hyper)parameter. (B) Results of a parameter recovery study (Ahn et al., 2011) between HBA and maximum likelihood estimation. Thirty subjects’ data from the Iowa gambling task were simulated using true parameters (black circles), and the parameters were estimated with hierarchical Bayesian analysis (blue squares = the individual posterior means) and individual maximum likelihood estimation (yellow triangles). The performance of the two approaches is shown for the loss aversion parameter (λ).

