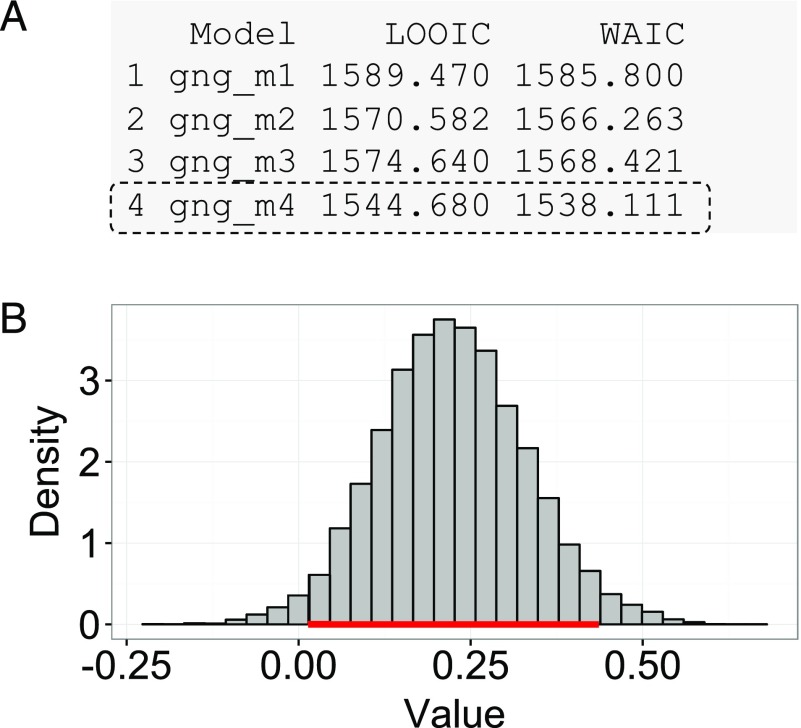
Figure 6. .
Bayesian model selection and group comparison. (A) Sample output of the printFit() command, which prints model performance indices (LOOIC and WAIC) for competing model(s). The resulting table shows the name of each model, followed by their LOOIC and WAIC values. Lower LOOIC and WAIC values correspond to better model performance. Here, gng_m4 (highlighted with a dashed box) has the lowest values. (B) Results from the plotHDI() function, showing the 95% highest density interval (HDI) of the posterior distribution difference between two group parameters. The red bar indicates the 95% HDI.

