. 2018 Mar 12;7:e26016. doi: 10.7554/eLife.26016

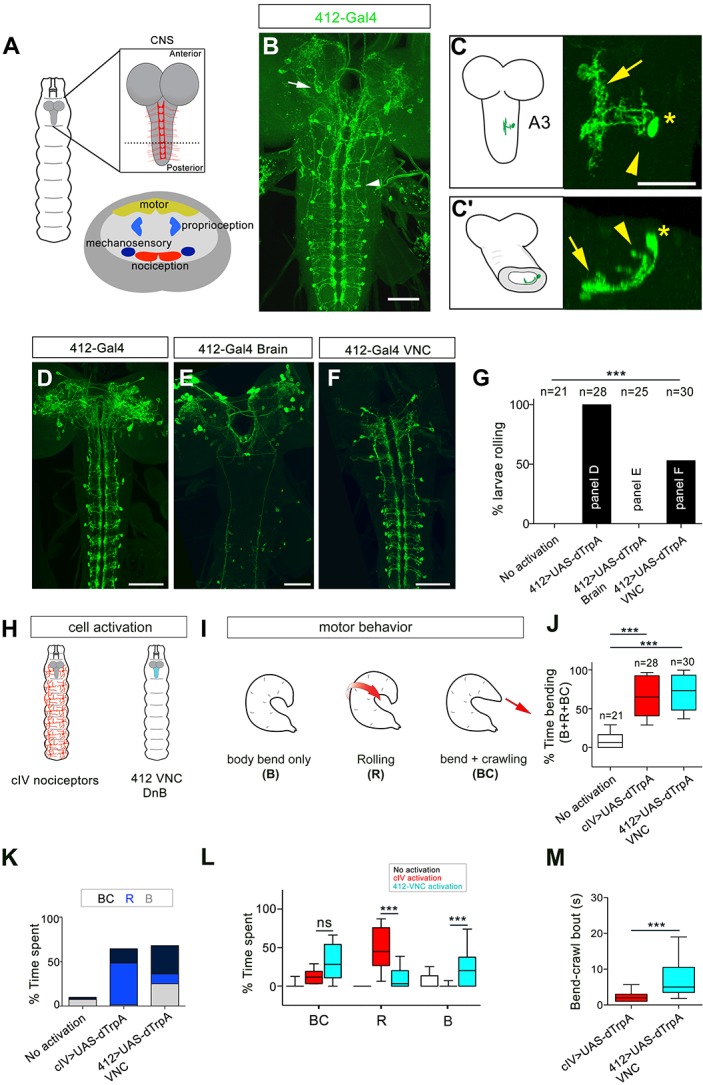
Figure 1. Identification of candidate nociceptive interneurons.

(A) Schematic showing the Drosophila larval CNS. Red scaffold represents class IV (cIV) projections. Enlarged transverse section through ventral nerve cord (VNC) is shown below. Color-coded regions depict modality specific locations where sensory axons terminate and motor neuropil. (B) 412-Gal4 drives expression in interneurons in the VNC (arrowhead) and neurons in the brain lobes (arrow), anti-dsRed, green. (C–C') Dorsal view of the morphology of DnB neuron in segment A3. Medial process is indicated by an arrow and lateral projection by an arrowhead. An asterisk marks the cell body. (C') Transverse section of neuron in C. (D–F) Intersectional strategy to target GFP either to D) the brain and VNC, (E) brain only or F) VNC only. Green channel shows anti-GFP labeling. (G) Percent exhibiting nocifensive rolling during dTrpA1 activation of subsets of 412-Gal4 neurons corresponding to panels D-F. (H) Schematic of cIV nociceptors (left) and location of 412-Gal4 VNC neurons (right). (I) Schematic of different motor behaviors observed in response to cIV or 412-Gal4 VNC activation. Body bend only, B, larvae entered a curved C-shape but did not roll or crawl; Rolling, R, animals entered C-shape and performed 360˚ rotations; Bend + crawling, BC, larvae attempted to crawl while remaining in a C-shape. Red arrows show direction of locomotion. (J) Total amount of time spent in bent-body positions (B + R + BC) upon dTrpA1-induced activation of cIV neurons and 412-Gal4 VNC neurons. (K) Percent of time upon dTrpA1 activation spent in bent-body positions with crawling (black) rolling (blue) or paused (bend-only, gray). (L) Percent of time spent during 29 s trial in bent-body positions: bend-crawl, rolling, or bend-only. (M) Plot showing length of bend-crawl bouts in seconds upon cIV or 412-Gal4 VNC activation. Box plots show median (middle line) and 25th to 75th percentiles with whiskers representing 10 to 90 percentiles. P values are indicated as *p<0.05, ***p<0.001, as determined by One-way ANOVA with Tukey’s multiple comparison’s test (J), Kruskal-Wallis with Dunn’s correction for multiple testing (L), or Mann-Whitney (M). Scale bars = 50 µm (B, D–F), 20 µm (C). (See also Figure 1—figure supplements 14).

Figure 1—source data 1. Summary table of graph data and statistical testing for thermogenetic activation experiments.
Genotypes, number of animals tested, graph data and statistical testing presented for thermogenetic activation experiments.
DOI: 10.7554/eLife.26016.007

Figure 1.

Figure 1—figure supplement 1. 4051-Gal4 expression pattern.
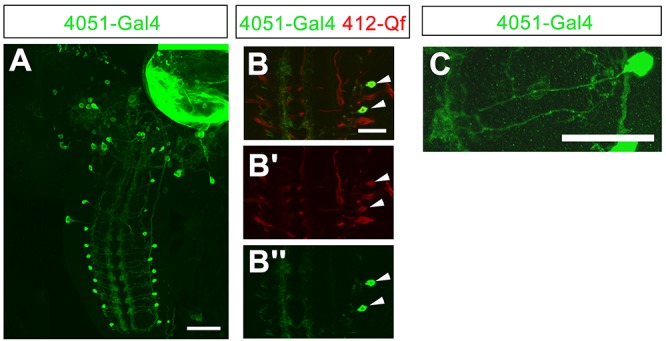
Figure 1—figure supplement 1.

(A) Expression pattern of 4051-Gal4. (B–B'') Co-labeling of 4051-Gal4 and 412-QF in DnB neurons (arrowheads). Some additional expression of 412-QF appeared in trachea after InSITE swapping procedure. (C) Expression of 4051-Gal4 in single hemisegment. Genotype: (A–C) UAS-mCD8GFP/+;4051-Gal4/412-Qf,QUASTdTomato/+. Scale bars = 50 µm (A); 20 µm (B–C).
Figure 1—figure supplement 2. Further analysis of 412-Gal4 expression.
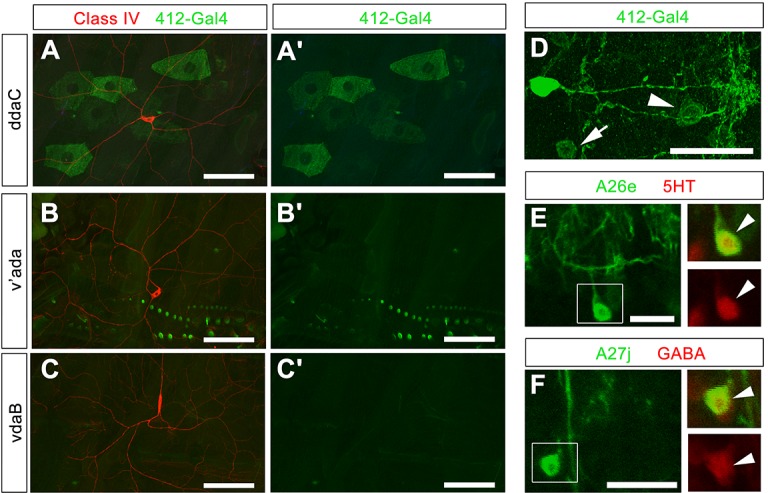
Figure 1—figure supplement 2.

(A–C') 412-Gal4, UAS-mCD8:GFP does not label cIV cell bodies or dendrites labeled by ppk-CD4-tdTomato (anti-GFP, green; anti-dsRed, red). (D) Expression of 412-Gal4 in single hemisegment. Two non-DnB cell types are labeled in 412-Gal4 pattern: A26e (arrowhead) and A27j (arrow). (E) A26e neuron, GFP channel only, Boxed region from (E): A26e cell body (arrowhead), Overlap between A26e and serotonin antibody (anti-GFP, green; anti-5HT, red) (top); 5HT staining; dsRed channel only (bottom). (F) A27j neuron, GFP channel only, Boxed region from (F): A27j cell body (arrowhead), Overlap between A27j and GABA antibody (anti-GFP, green; anti-GABA, red) (top) GABA staining, dsRed channel only (bottom). Genotypes: (A–C') ppk:CD4tdTomato/+; 412-Gal4, UAS-mCD8:GFP /+ (D–F) 412-Gal4, UAS-mCD8:GFP /+. Scale bars = 50 µm (A– C'); 20 µm (D); 10 µm (E–F).
Figure 1—figure supplement 3. DnB polarity analysis.
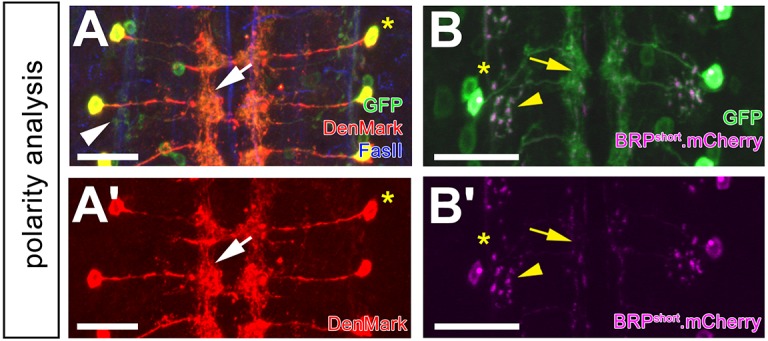
Figure 1—figure supplement 3.

(A–A') 412-Gal4 driven dendritic marker, DenMark (anti-dsRed, red) localizes to medial-directed projection, and medial arbors (arrow). UAS-mCD8:GFP (anti-GFP, green) is abundant throughout all projections. FasII labels axon fascicles. Asterisk marks the cell body. (A') DenMark channel alone. (B–B') 412-Gal4-driven BRP.shortmCherry labels putative presynaptic sites sparsely in the medial domain (arrow) and strongly in the lateral domain (arrowhead; anti-dsRed, magenta). UAS-mCD8:GFP (anti-GFP, green) labels all processes. Asterisk labels the cell body. (B') BRP.shortmCherry channel alone. Genotypes: (A–A') UAS-DenMark/+; 412-Gal4, UAS-mCD8:GFP/+. (B–B') UAS-BRP.shortmCherry/+;412-Gal4, UAS-mCD8:GFP/+. Scale bars = 20 µm (A–B’).
Figure 1—figure supplement 4. 412-Gal4, 4051-Gal4, and off target activation.
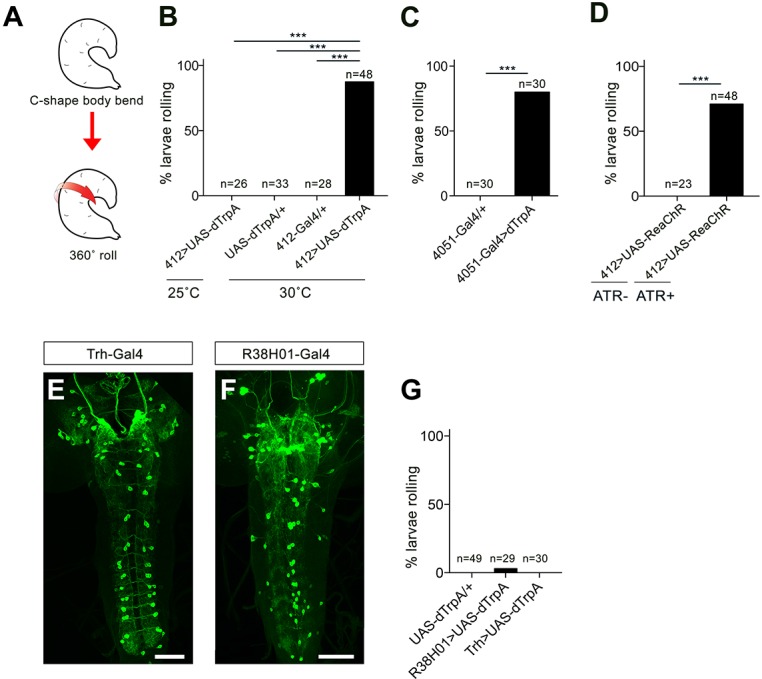
Figure 1—figure supplement 4.

(A) Schematic representation of nocifensive escape behavior, which includes C-shaped body bending and 360˚ rolls. (B) Percentage of animals exhibiting rolling behavior during dTrpA1 activation driven by 412-Gal4. (C) Percentage of animals exhibiting rolling behavior during dTrpA1 activation driven by 4051-Gal4. (D) Percentage of animals exhibiting rolling behavior with optogenetic activation of 412-Gal4 neurons using ReaChR with and without all-trans-retinal (ATR). (E) Expression pattern of Trh-Gal4 labeling serotonergic neurons. (F) Expression pattern of R38H01-Gal4 includes labeling of A27j neurons. (G) Percentage of larvae rolling upon R38H01-Gal4 or Trh-Gal4 dTrpA1. activation. *p-value<0.05, ***p- value <0.001 by Chi squared test with Bonferroni correction for cases of multiple testing. Genotypes: (B) (i) UAS-dTrpA1/+;412-Gal4/+ (ii) UAS-dTrpA1/+ (iii) 412-Gal4/+ (C) (i) 4051-Gal4/+ (ii) UAS-dTrpA/+;4051-Gal4/+(D) UAS-ReaChR/412-Gal4 (E) 20X-UAS-mCD8GFP/+;Trh-Gal4/412-QF,QUASTdTomato (F) 20X-UAS-mCD8GFP/Per-Gal4;412-Qf,QUASTdTomato/+ (G) (i) UAS-dTrpA/+ (ii) UAS-dTrpA/+;38H01-Gal4/+ (iii) UAS-dTrpA/+;Trh-Gal4/+. Scale bars: 50 μm (E–F).
Figure 1—figure supplement 4—source data 1. Summary table of graph data and statistical testing for activation experiments.
Genotypes, number of animals tested, graph data and statistical testing presented for 412-Gal4, 4051-Gal4 and off-target activation experiments.
DOI: 10.7554/eLife.26016.008