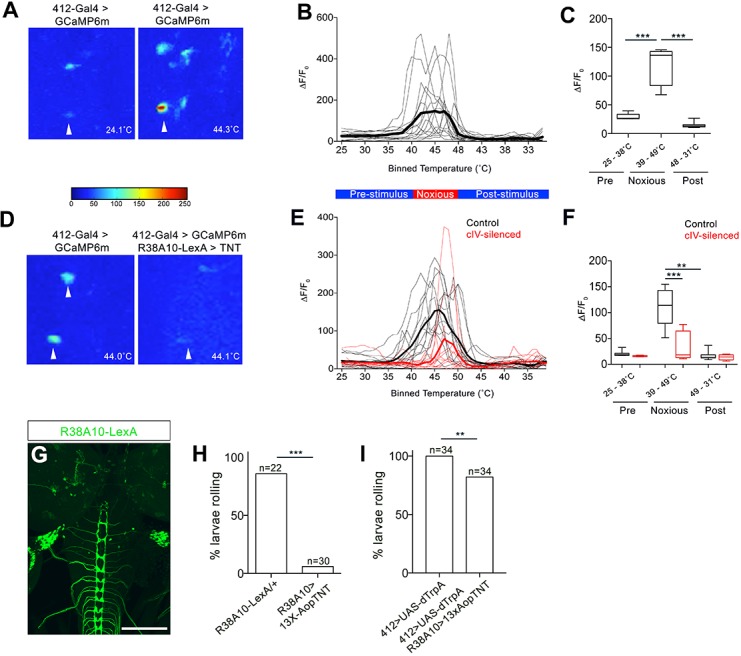
Figure 3. DnBs are activated by noxious heat downstream cIV sensory neurons.

(A) Representative heat maps showing Ca2+ responses in DnB cell bodies (arrowhead) before (~24˚C) and during (~44˚C) local noxious heat stimulation of the body wall. (B) Individual Ca2+ responses (thin lines) and average of all trials (bold) represented as ∆F/F0 in DnB cell bodies (n = 15). Larvae received local heat stimulation at segment A7 using a heat probe that was increased from ~24–49˚C, then cooled to ~30˚C. (C) GCaMP signal binned for 25–38˚C (below noxious threshold), 39–49˚C (above noxious threshold), and 48–31˚C (post-stimulus cool down). (D) Representative heat maps showing Ca2+ responses in DnB cell bodies at ~44˚C (arrowhead) with or without cIVs silenced with R38A10-LexA driving TNT. (E) Individual Ca2+ responses (thin lines) and average of all trials (bold) in DnB cell bodies during heating and cooling, Black lines represent control (n = 12) and red lines represent cIV silenced trials (n = 11). (F) GCaMP signal binned for 25–38˚C (below noxious threshold), 39–49˚C (above noxious threshold), and 49–31˚C (post-stimulus cooling) for control and cIV silenced trials. (G) R38A10-LexA driven 13XlexAop2-IVS-myr::GFP labels cIV sensory neurons (anti-GFP, green) and sparse labeling of brain neurons. (H) Percent of larvae rolling in response to local noxious stimuli decreased when cIV neurons were silenced using R38A10-LexA to drive tetanus toxin light chain (TNT). (I) Percentage of animals exhibiting rolling responses when 412-Gal4 neurons were induced by dTrpA1 with and without cIV-silencing via R38A10-LexA driven tetanus toxin light chain (TNT). *p-value<0.05, **p-value<0.01, ***p- value <0.001 by Chi squared test with Bonferroni correction for cases of multiple testing (H–I). Kruskal-Wallis with Dunn’s correction for multiple testing and post-hoc Unpaired T-test or Wilcoxon test (C) or post-hoc T-test or Wilcoxon test (F). Scale bars = 70 µm (G).
