. 2018 Feb 22;7:e32532. doi: 10.7554/eLife.32532

Figure 3. Rolling correlates with expression of selectin ligands and FUT7 and ST3GAL4.

(A) Expression of adhesion molecules on untreated HUVECs and TNFα-treated HUVECs. Staining of untreated HUVECs with the four different antibodies and TNFα-treated HUVECs with isotype-matched antibodies are shown as negative controls. Data are from one representative of three experiments. (B) Percentages of cells binding to the E-selectin-Fc and P-selectin-Fc chimeric proteins. CD8α+ T cells were divided into subsets as in Figure 1B and shown in Figure 2—figure supplement 1. (C) Percentages of sLeX-positive cells within each CD8α+ T cell subset. (B and C) Bars show means, and data are from cells from six (B) or those six plus two additional (C) donors, each identified by a unique symbol within each panel. The p values were calculated using the Wilcoxon signed rank test. (D) Numbers of cells rolling per field on TNFα-activated HUVECs for CD8α+ T cell subsets, either untreated or pre-treated with sialidase. Bars show means from cells from two donors as represented by the two symbols. (E) Expression of FUT7, ST3GAL4 and GCNT1 in CD8α+ T cell subsets; shades of red and numbers displayed in each box represent relative levels of expression based on values for 2−ΔCT obtained by real-time RT-PCR. Data are averaged from cells from three donors. (B and C) *, p<0.05; **, p<0.01.

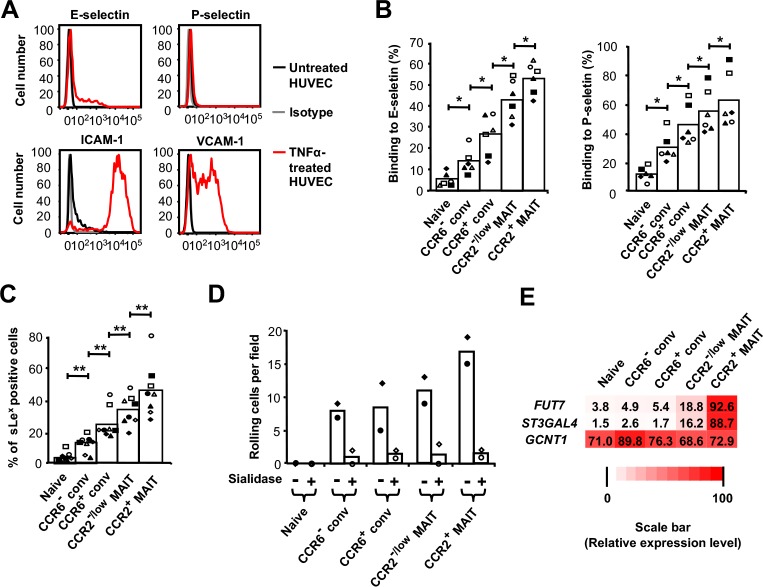
Figure 3—source data 1. Data for Figure 3B, C (flow cytometry results for cells from individual donors), Figure 3D (flow chamber results for cells from individual experiments), and Figure 3E, (normalized mRNA expression in cells from individual experiments).
DOI: 10.7554/eLife.32532.014

Figure 3.

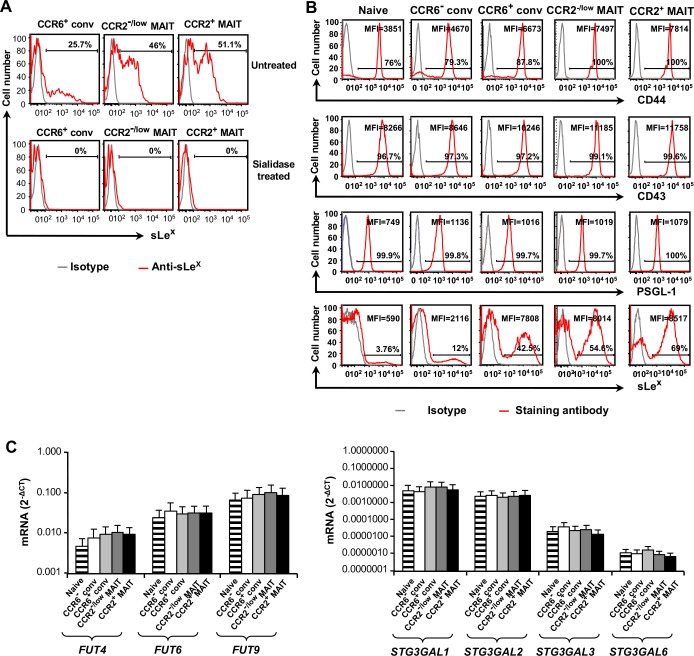
Figure 3—figure supplement 1. Selectin ligands and glycosyltransferases in CD8α+ T cells.

Figure 3—figure supplement 1.

(A) Staining of CD8α+ T cell subsets either untreated (top) or after treatment with sialidase (bottom) for sLeX. Staining with an isotype-matched antibody served as a negative control. Percentages of cells staining positive are indicated by the horizontal lines. Data are from one of two experiments. (B) Staining of CD8α+ T cell subsets is shown for sLeX and proteins that can serve as selectin ligands. Percentages of cells staining positive are indicated by the horizontal lines. MFI numbers are mean fluorescent intensities. Staining with isotype-matched antibodies served as negative controls. For each surface molecule data are from cells from one representative of four donors. (C) Expression of mRNAs encoded by the glycosyltransferase genes normalized to GAPDH expression in the CD8α+ T cell subsets. Bars show means and SEMs for cells from three donors.
Figure 3—figure supplement 1—source data 1. Data for Figure 3—figure supplement 1B, mRNA expression in cells from individual experiments.
DOI: 10.7554/eLife.32532.015