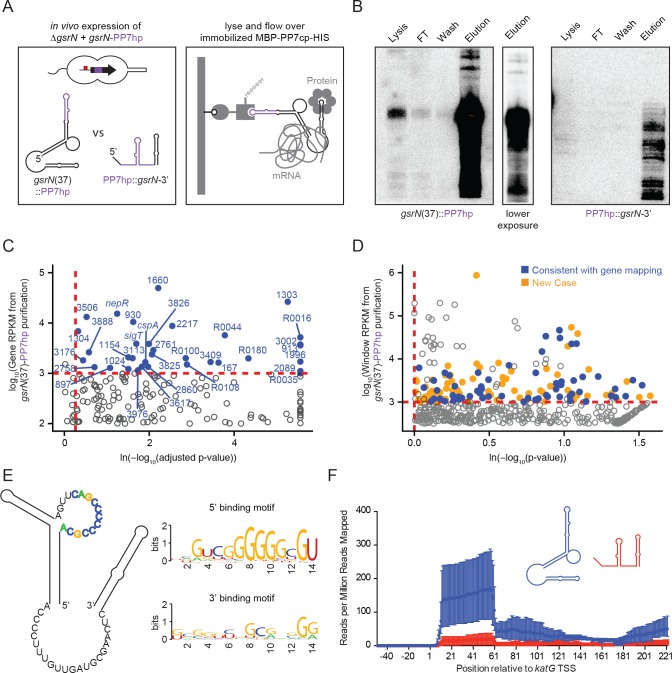
Figure 5. GsrN co-purifies with multiple RNAs, including catalase/peroxidase katG mRNA.
(A) GsrN-target co-purification strategy. GsrN(black)-PP7hp(purple) fusions were expressed in a ΔgsrN background. PP7 RNA hairpin (PP7hp) inserted at nucleotide 37 (gsrN(37)::PP7hp) was used as the bait. PP7hp fused to the 3’ hairpin of gsrN (PP7hp::gsrN-3’)served as a negative control. Stationary phase cultures expressing these constructs were lysed and immediately flowed over an amylose resin column containing immobilized PP7hp binding protein (MBP-PP7cp-His). (B) GsrN-PP7hp purification from strains bearing gsrN(37)::PP7hp (left) and PP7hp::gsrN-3’ (right) was monitored by Northern Blot with probes complementary to 5’ end of GsrN and PP7hp, respectively. Lysate, flow through (FT), buffer wash, and elution fractions are blotted. Approximately 1 µg RNA was loaded per lane, except for buffer wash (insufficient amount of total RNA). (C) Annotation-based analysis of transcripts that co-purify with gsrN(37)::PP7hp (Figure 5—source data 1). Log10 reads per kilobase per million reads (RPKM) is plotted against the ln(-log10(false discovery rate corrected p-value)). Dashed red lines mark the enrichment co-purification thresholds. Genes enriched in the gsrN(37)::PP7hp purification compared to PP7hp::gsrN-3’ are blue; labels correspond to gene names or C. crescentus strain NA1000 CCNA GenBank locus ID. Data represent triplicate purifications of gsrN(37)::PP7hp and duplicate PP7hp::3’GsrN control purifications. Log adjusted p-values of zero are plotted as 10−260. (D) Sliding-window analysis of transcripts that co-purify with gsrN(37)::PP7hp (Figure 5—source data 2). Points represent 25 bp genome windows. RPKM values for each window were estimated by EDGE-pro; p-values were estimated by DESeq. Windows that map to genes identified in (C) are blue. Orange indicates windows with significant and highly abundant differences in mapped reads between gsrN(37)::PP7hp fractions and the PP7hp::gsrN-3’ negative control fractions. Dashed red lines denote cut-off value for windows enriched in the gsrN(37)::PP7hp fractions. Grey points within the dashed red lines are signal that mapped to rRNA. (E) Predicted loops in GsrN accessible for mRNA target base pairing are emphasized in colored texts. A putative mRNA target site complementary to a cytosine-rich tract in the 5’ GsrN loop is represented as a sequence logo. Similar logo was generated for the target site sequences complementary to the 2nd exposed region in the 3’ end of GsrN. Logo was generated from IntaRNA 2.0.2 predicted GsrN-binding sites in transcripts enriched in the gsrN(37)::PP7hp pull-down. 5’ binding motif is present in 32 of the transcripts identified in (C) and (D) and 3’ binding motif is present in 27 of the transcripts identified in (C) and (D). (F) Density of reads mapping to katG that co-purified with gsrN(37)::PP7hp (blue) and PP7hp::gsrN-3’ (red). Read density in each dataset represents read coverage at each nucleotide divided by the number of million reads mapped in that data set. Data represent mean ±SD of three replicate gsrN(37)::PP7hp and two replicate PP7hp::gsrN-3’ purifications.


