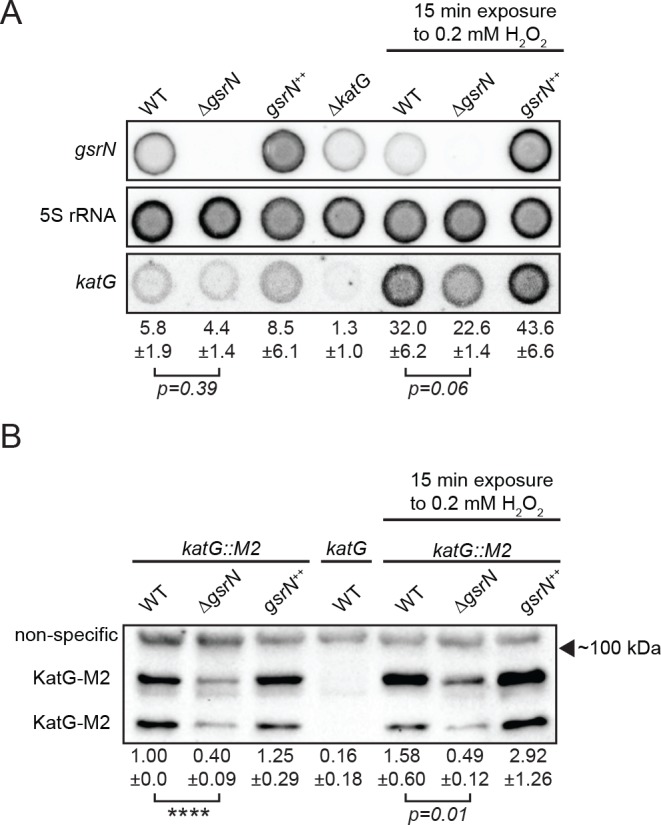
Figure 7. GsrN affects KatG and katG mRNA levels in vivo.

(A) Dot blot of total RNA of gsrN and katG mutants grown to early stationary phase (OD6600.85–0.9; this is the growth phase we used to initiate stress assays). Samples on right were treated with 0.2 mM hydrogen peroxide for 15 min before RNA extraction. These conditions were chosen to evaluate the effects of peroxide without ablating the ∆gsrN cultures. Blots were hybridized with katG mRNA, GsrN or 5S rRNA probes. katG mRNA signal normalized to 5S rRNA signal is quantified (mean ±SD, n = 3, p-value estimated with Student’s t-test). (B) Immunoblot of KatG-M2 fusion in wild type, ΔgsrN, and gsrN++ strains in the presence and absence of peroxide stress probed with α-FLAG antibody. KatG migrates as two bands as previously reported (Italiani et al., 2011). Normalized KatG-M2 signal (mean ±SD, n = 4, ****p<0.0001 Student’s t-test) is presented below each lane. Arrow indicates position of 100 kDa molecular weight marker.
