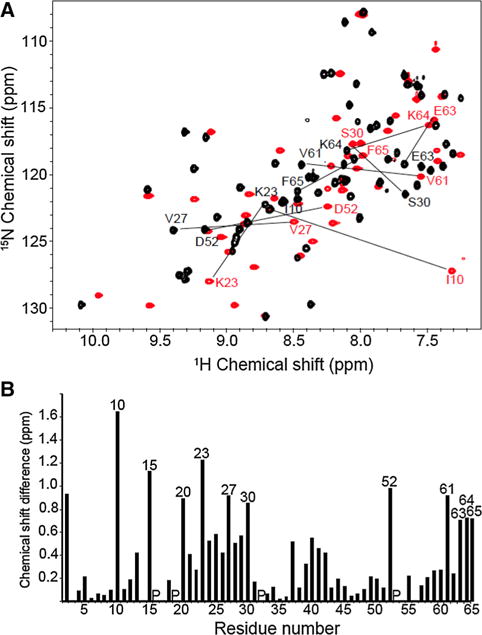
Fig. 1.

a Two-dimensional 1H/15N HSQC spectra of uniformly 15N labeled dimeric and monomeric IL-8 obtained under identical conditions in 20 mM HEPES buffer at pH 7.3 and temperature of 313 K. The spectra of dimeric full-length IL-8 (1–72) (in black) and of monomeric IL-8 (1–66) (in red) are superimposed with selected amide backbone resonances marked by their sequential assignments. b Bar graph of the weighted chemical shift differences observed between the resonances of dimeric IL-8 (1–72) and monomeric IL-8 (1–66) as a function of residue number; the resonances with the largest differences are marked by their sequential assignments
