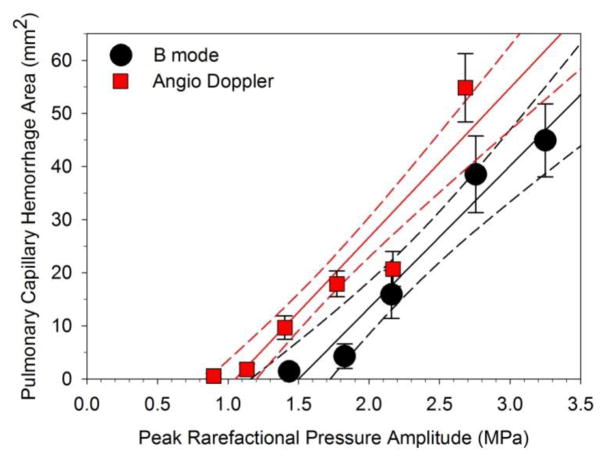
Figure 3.
A plot of the pulmonary capillary hemorrhage area measurements for B mode (black circles) and Angio Doppler mode (red squares) for the PRPAs used. A linear regression is shown for each plot (lines) with 95% confidence intervals (dashed lines). Each point is the mean for six rats with standard error bars. Both trends are increasing area above a threshold.

