
Figure 7.
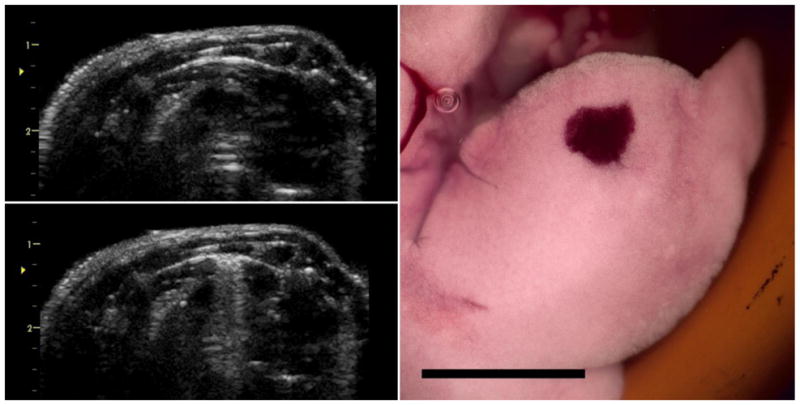
Images for the pulsed Doppler mode exposure at 0 dB (maximum power), presented as for the Angio Doppler mode. The initial B mode image (upper left) shows the bright-line lung reflection, followed by the narrow comet tail artifact display (lower left) after 5 min. The right medial lung lobe (right) has the characteristic hemorrhage spot corresponding to the pulsed Doppler aim point. Scale bar 1 cm.