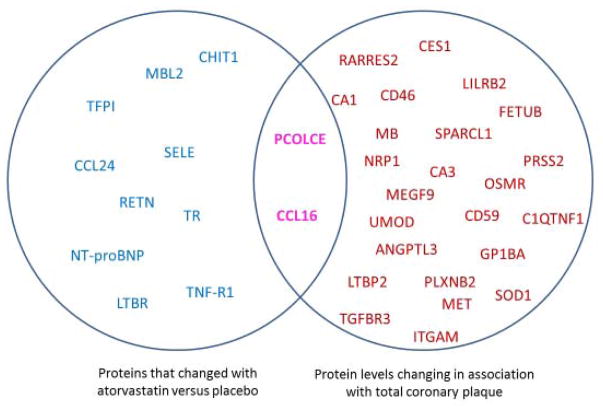
Figure 3. Intersection of Discovery Approaches.
The potential intersection of proteomic biomarkers that are influenced by atorvastatin therapy and those associated with total coronary plaque volume. Proteins shown on the left in blue change in response to statin vs. placebo. Proteins shown on the right in red are those with changes significantly associated with change in total plaque. Protein levels that change in response to atorvastatin and whose change is associated with change in total coronary plaque are shown at the intersection of the circles in purple. For details on change with statin vs. placebo and degree and direction of change with plaque, see Tables 1 and Table 2. For full list of abbreviations, see Supplemental Tables 1 and 2.

