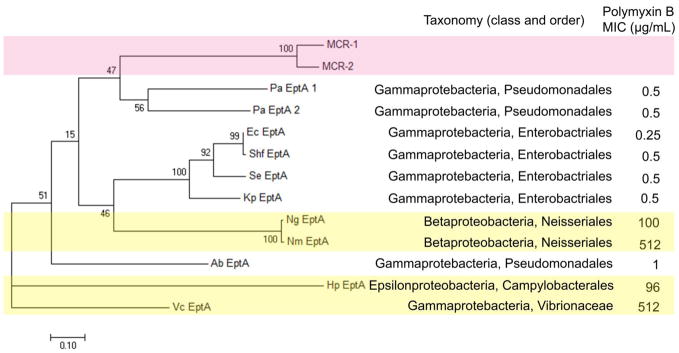
Fig. 3.
Phylogenetic tree constructed with 11 EptA and MCR-1, MCR-2 sequences by MEGA 7 based on the maximum likelihood method. The scale bar corresponds to proportional length of branch presenting an amount genetic change of 0.10. The percentage bootstrap support (per 1000 replicates) was indicated by the values at each node. Bootstrap support values (%) based on 1,000 replicates are indicated by the values at each node. The number (in percentage) next to each node represents a measure of support for the node. The taxonomy and polymyxin B MICs are listed on the right side. MCR-1 and MCR-2 sequences are highlighted in light pink, whereas four polymyxin-resistant V. cholerae, N. meningitides, N. gonorrhoeae and H. pylori are highlighted in light yellow. The following abbreviations are used to denote the bacteria in the figure, Nm: N. meningitides, Ng: N. gonorrhoeae, Ec: E. coli, Shf: Sh. flexneri, Se: S. enterica, Kp: K. pneumoniae, Pa: P. aeruginosa, Ab: A. baumannii, Vc: V. cholera, and Hp: H. pylori.

