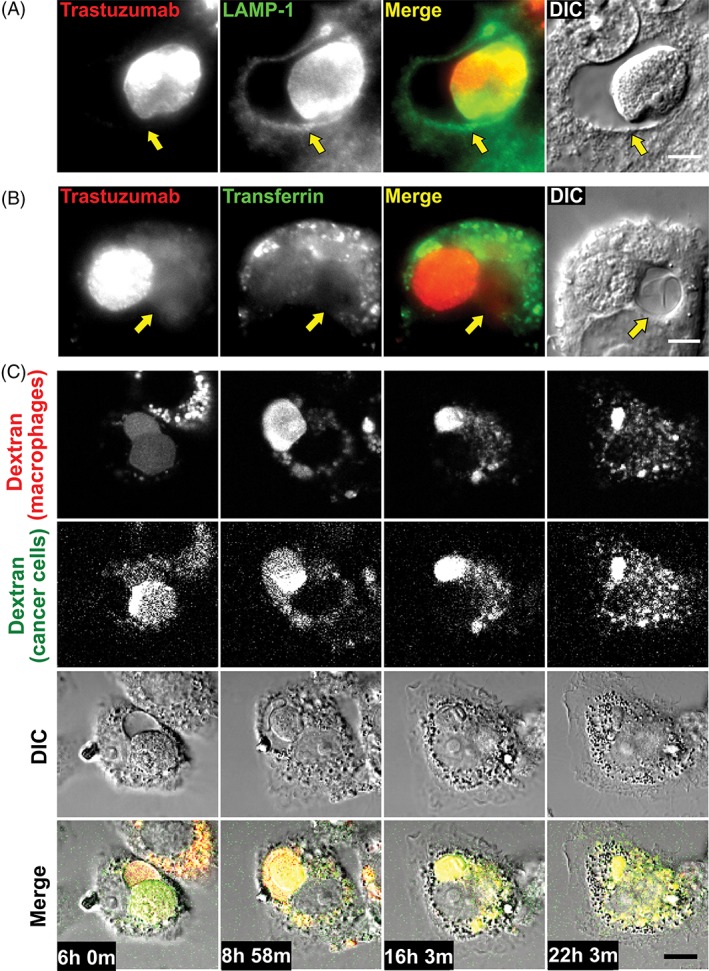
Figure 2.

The phagosome and vacuole are LAMP‐1+ and their contents are redistributed throughout the lysosomal network of the macrophage. A, MDA‐MB‐453 cancer cells were opsonized with Alexa 488‐labeled trastuzumab and co‐incubated with J774A.1 macrophages for 1 hour followed by addition of 10 mg/mL IVIG and incubation for a further 6 hours. Cells were fixed, permeabilized, and LAMP‐1 was detected using a LAMP‐1‐specific antibody followed by an Alexa 647‐labeled secondary antibody. Fluorescent and DIC images are shown, with Alexa 488 (trastuzumab) pseudocolored red, and Alexa 647 (LAMP‐1) pseudocolored green. B, MDA‐MB‐453 cancer cells were opsonized with Alexa 488‐labeled trastuzumab and co‐incubated with J774A.1 macrophages for 1 hour followed by addition of 10 mg/mL IVIG and incubation for a further 6 hours. Cells were pulsed with 10 μg/mL Alexa 555‐labeled human transferrin at 37°C for the last 10 minutes of the incubation and then cells were washed and imaged as live cells. Fluorescent and DIC images are shown, with Alexa 488 (trastuzumab) pseudocolored red and Alexa 555 (transferrin) pseudocolored green. C, MDA‐MB‐453 cancer cells opsonized with trastuzumab were co‐incubated with J774A.1 macrophages. The cancer cells were preloaded with Alexa 555‐labeled 10 kDa dextran (pseudocolored green), and the macrophages were preloaded with Alexa 488‐labeled 10 kDa dextran (pseudocolored red). Imaging (fluorescence and DIC) was initiated 6 hours following the start of the co‐incubation. The panels show 4 frames from the time series, with times corresponding to each frame indicated. Yellow arrows in A and B indicate the position of the vacuole. Images of representative cells from at least 14 cells and 2 independent experiments are shown. Scale bar = 5 μm
