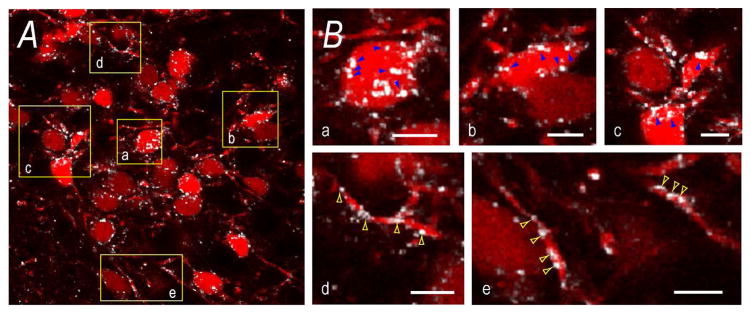
Figure 10. Appositions to CRH Neurons in the Mouse PVHmpd.
Panel A) is panel e) from Figure 9. It shows VGAT appositions (white) to TdTomato-labeled CRH soma. To highlight somatic and non-somatic appositions, panel B) shows magnified regions (yellow boxes) from A). Blue arrows in a), b), and c) indicate some VGAT appositions to CRH soma. Yellow arrows in d) and e) indicate some VGAT appositions to non-somatic regions, presumably dendrites. Scale bars represent 20μm in A), and 5μm in B).

