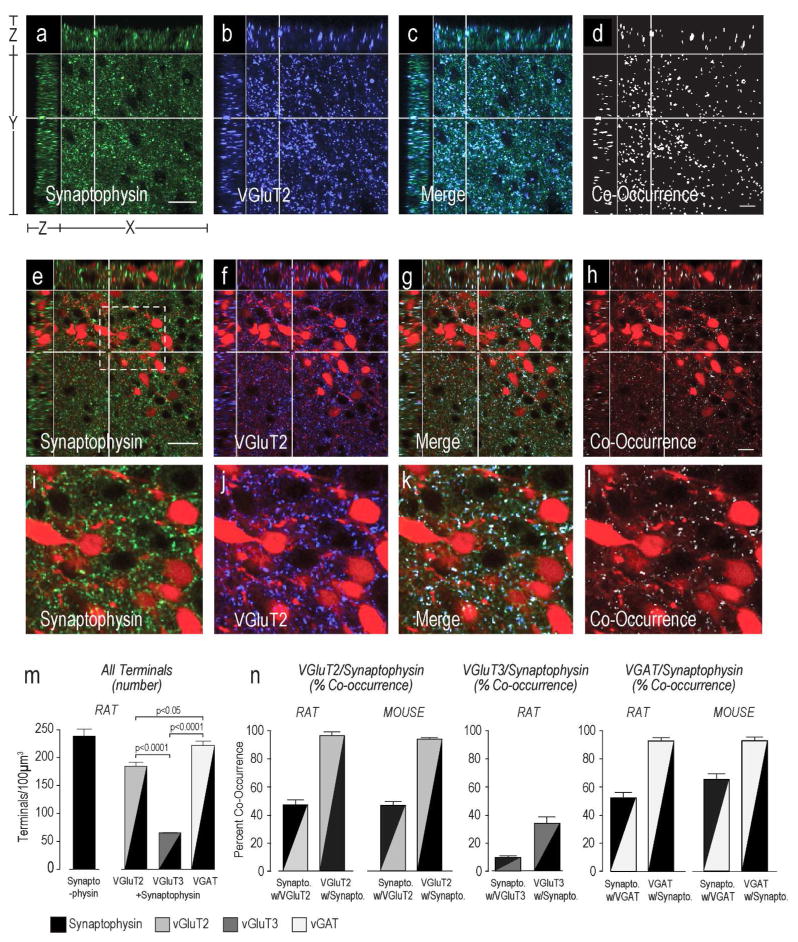
Figure 4. VGluT2 and VGAT, but not VGluT3 are Expressed Exclusively in Pre-Synaptic.
Terminals Synaptophysin (a,e,i), VGluT2 (b,f,j), and terminals labeled with both molecules (c,d, g,h, and k,l) in the rat (a–d) and mouse (e–l) PVHmpd (see Fig. 1 for orientation). TdTomato-labeled CRH soma are visible in the mouse panels. Equivalent images are not shown for VGAT or VGluT3. Please see Figure 2 for more information about the general organization of the confocal image panels. Panels i-l show higher magnification images of the area indicated by the dashed line square in e. Scale bar in a) and e) indicates 20μm for panels a – h. Scale bar in i indicates 100em. All VGluT2 and VGAT occurs in rat and mouse (female) pre-synaptic terminals (m,n), but not not all VGluT3 occurs in rat pre-synaptic terminals (m,n). There are significantly more VGAT presynaptic terminals than either Glu transporters, and significantly more VGluT2 than VGluT3 terminals (n). Error bars represent the mean + S.E.M.

