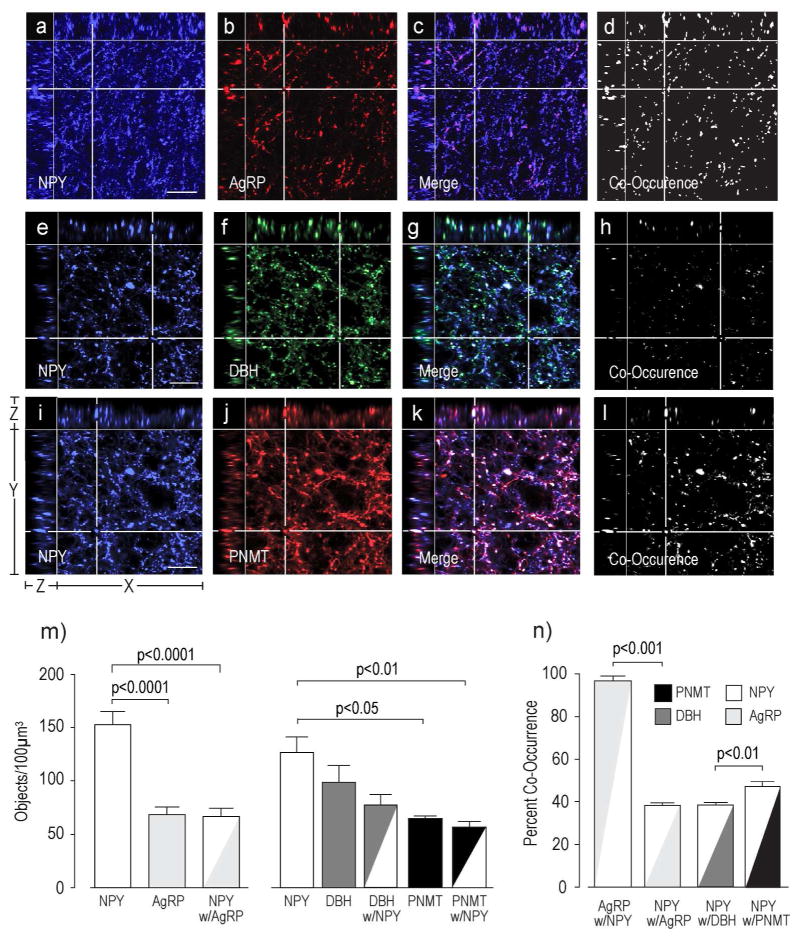
Figure 8. Co-Occurrence of NPY with AgRP, DBH, or PNMT.
Panels a) – l) show NPY-ir with AgRP-ir (a–d), NPY with DBH-ir only (e-h), or NPY with PNMT-ir only (i–l) in the rat PVHmpd. Co-occurring structures (c,d, g,h, k,l) were identified and counted (m), together with their percent co-occurrence (n). Please see Figure 2 for more information about the general organization of the confocal image panels. Scale bars indicates 20μm. Error bars indicate mean + S.E.M.

