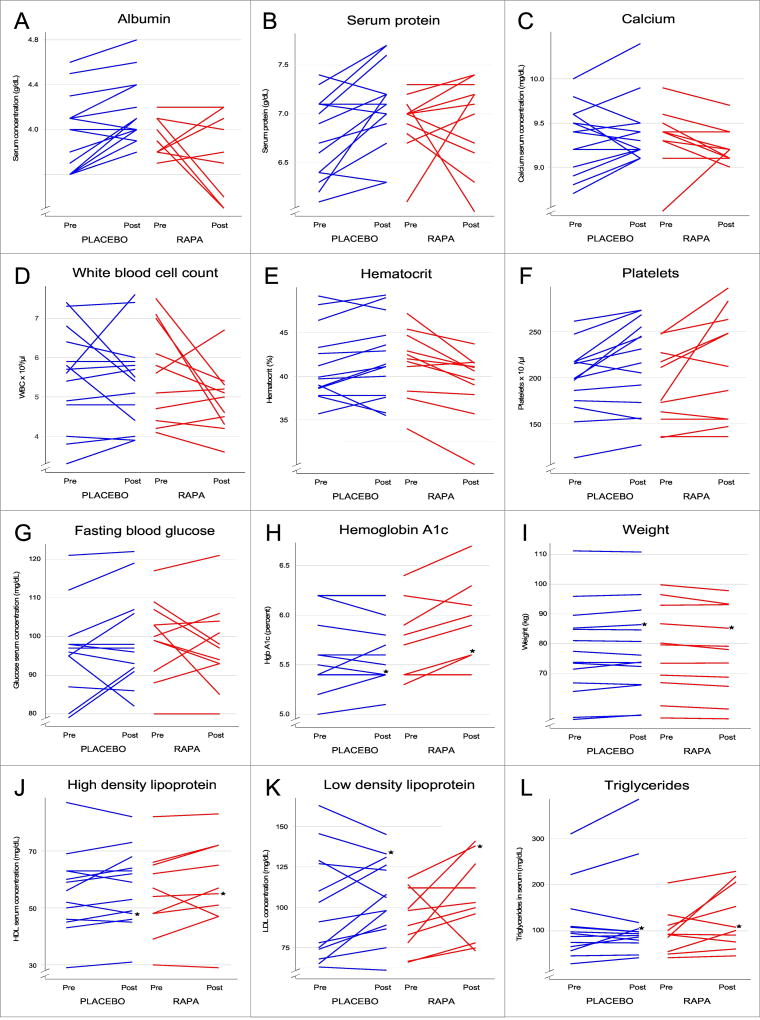
Figure 1. Effects of RAPA on clinical parameters.
Shown are the changes in several measures of clinical health for individual subjects in the RAPA (red) and placebo (blue) treatment groups. The “pre” points were taken at time 0, prior to the initiation of treatment. Most of the “post” values were taken at the 6–8 week visit, but for a few subjects, data were only available at 16 weeks (indicated with a star, ★). All of the 6–8 week values for these and other parameters measured are summarized, with statistical analyses summarized in Tables 3–7.

