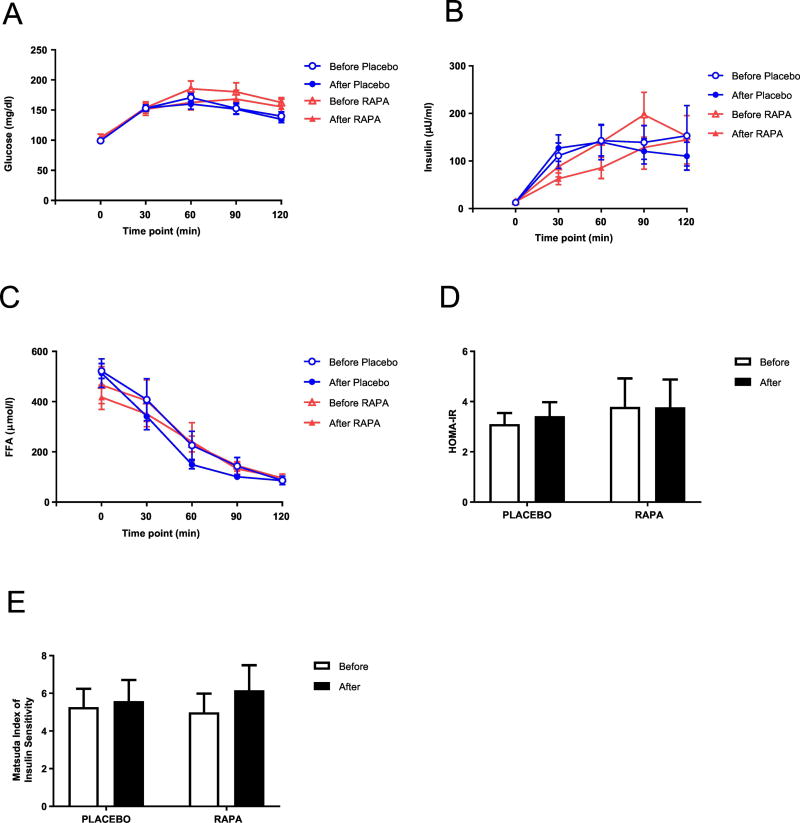
Figure 2. Effect of RAPA on metabolic profile.
Glucose (A), Insulin (B), and FFA (C) concentrations during OGTT, HOMA-IR (D), and Matsuda index (E) were determined as described under “Methods”. Values are mean ± SEM. No statistically significant differences between RAPA and placebo subjects were found.

