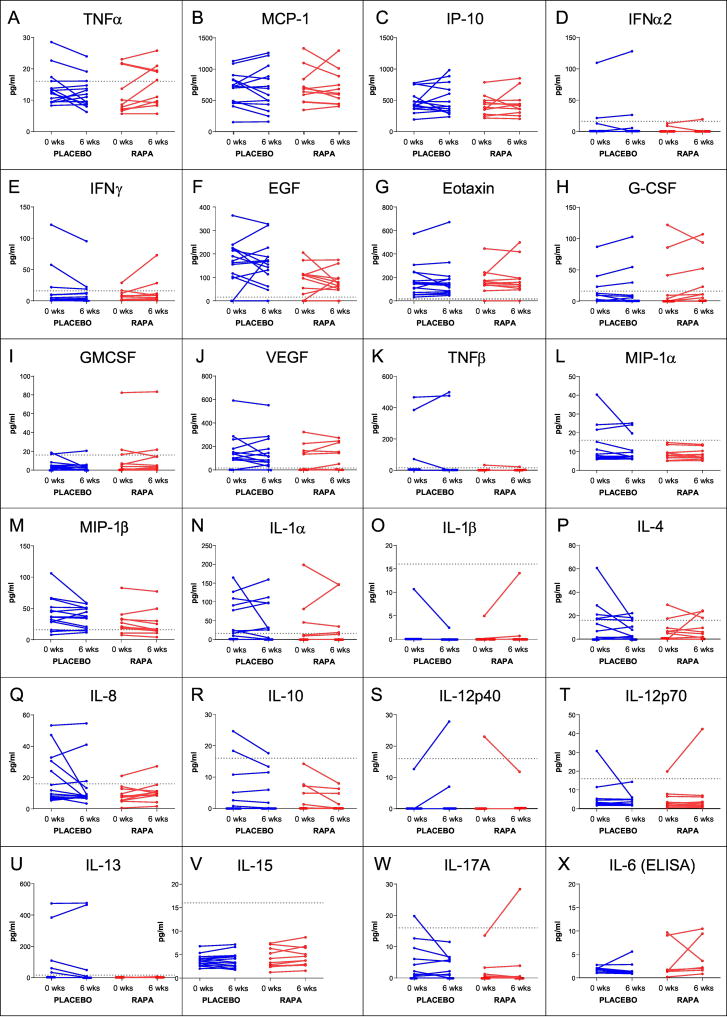
Figure 3. Effects of RAPA on serum cytokines.
As described in the Methods, the levels of serum cytokines were measured using either a Luminex-based multiplex assay (panels A–W) or a high sensitivity ELISA (panel X) for samples collected either before initiation of treatment (0 weeks) or during the treatment phase (6 weeks). All individual subjects, from both phase 1 and phase 2, are shown. RAPA subjects are shown in red and placebo subject lines are blue. For the Luminex data, the horizontal dotted line on each graph indicates the concentration value for the lowest point on the standard curve; all values below that were extrapolated by the BioRad software. Any point assigned a value of “OOR<” (out of range less than) was considered to be 0 pg/ml for the analysis. RAPA subjects (red) and placebo subjects (blue) are shown and the p-values for RAPA vs. placebo differences are found in Table 8.

