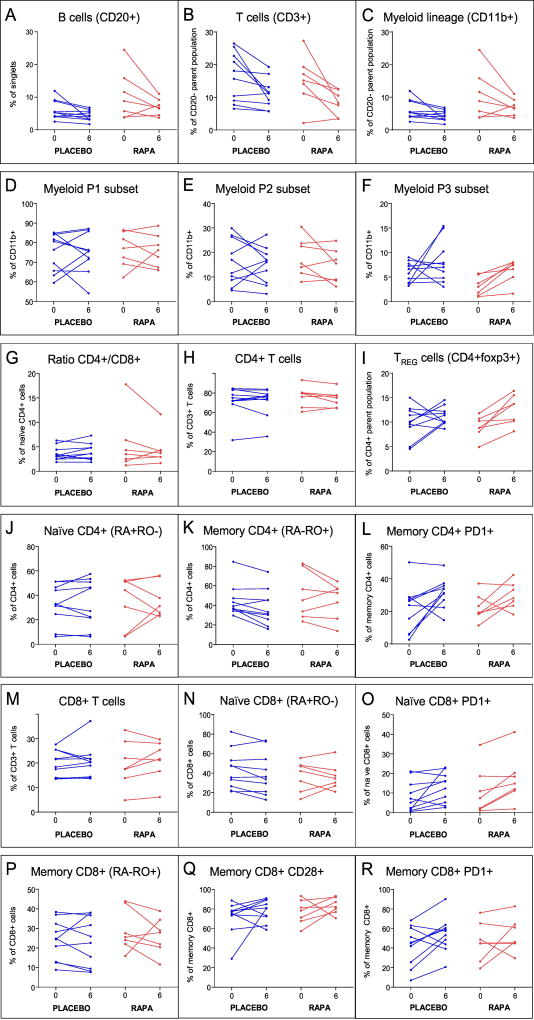
Figure 4. Effects of RAPA on blood cell subsets.
PBMCs from the phase 2 subjects, purified from blood collected at the indicated time points, were stained using the three antibody panels described in the Methods section. The flow cytometry data were analyzed using Diva software. Shown are results from Panel 1 (A–F), Panel 2 (H,I), and Panel 3 (G,J–R). RAPA subjects (red) and placebo subjects (blue) are shown and the p-values for RAPA vs. placebo differences are found in Table 9 for these subsets and for additional subsets not shown.

