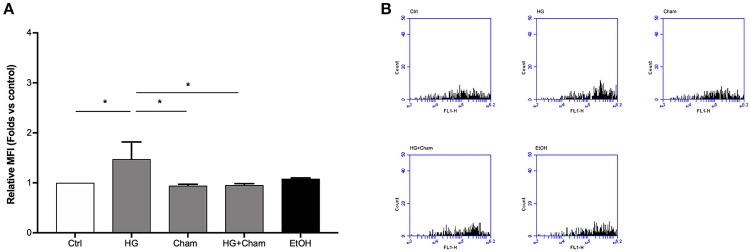
Figure 4.
Chamazulene and ROS levels in flow cytometry after HG treatment. (A) Histograms illustrate the relative MFI toward control derived from flow cytometry and show ROS levels when cells are treated with HG and their decrease in a simultaneous treatment with Cham and HG. Cham effect is not affected by ethanol. Data shown are mean ± SD of three independent experiments (HG: 1.47 ± 0.35; Cham: 0.94 ± 0.03; HG + Cham: 0.96 ± 0.02; EtOH: 1.08 ± 0.02); *P < 0.05 (B) Representative graphs of flow cytometry in which is illustrated the variation in fluorescence in different treatments.

