Figure 5.
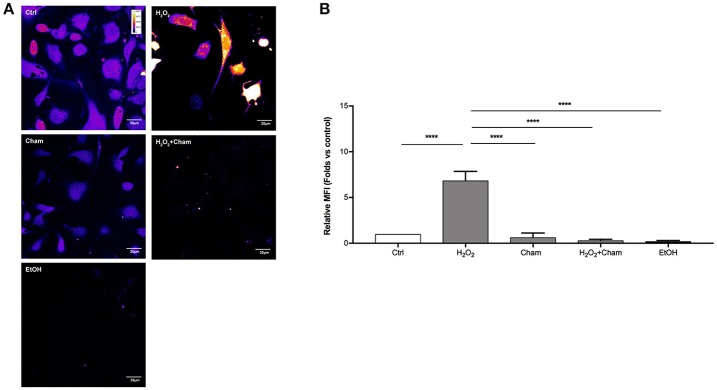
Chamazulene and ROS levels in confocal microscopy after H2O2 treatment. (A) Images obtained with confocal microscopy and DCFH-DA probe (magnification 60x). Fluorescence intensity is represented in pseudo color scale (“fire” in ImageJ software): H2O2 treatment for 3h induce augmented ROS levels as underlined by the changing color of cells compared to control and it was balanced by the simultaneous treatment with Cham. (B) Histograms illustrate the relative MFI toward control derived from images analysis and show high ROS levels when cells are treated with H2O2 and their decrease in a simultaneous treatment with Cham and H2O2. Ethanol does not affect ROS level. Data shown are mean ± SD of three independent experiments (H2O2: 6.86 ± 1.00; Cham: 0.65 ± 0.47; H2O2+Cham: 0.30 ± 0.13; EtOH: 0.22 ± 0.09); ****P < 0.0001.

