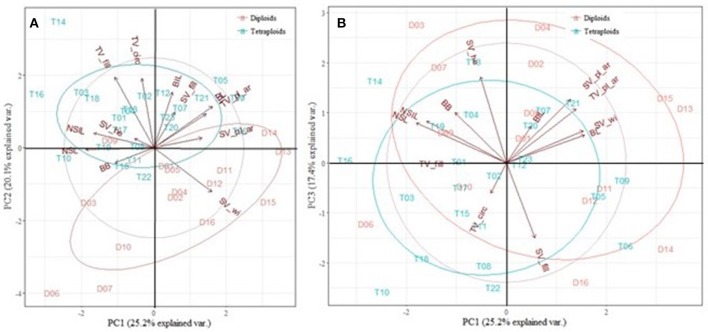
Figure 6.
Principal Component Analysis (PCA) of the diploids (D) and tetraploids (T) of Escallonia rubra. 5 PCs with an eigenvalue larger than one, explained 84.5% of the variation. (A) PC1 vs. PC2, with 45.3% of the variance. (B) PC1 vs. PC3, with 42.6% of the variance. NSL, new shoot length; NSIL, new shoot internode length; BB, axillary budburst; BL, branch length; BIL, branch internode length; TV_pl_ar, plant area in top view; TV_circ, circularity; TV_fill, % filled of the minimal bounding circle in top view; SV_pl_ar, plant area in side view; SV_he, plant heigth in side view; SV_wi, plant width in side view; SV_fill, % filled of the bounding rectangle in side view.

