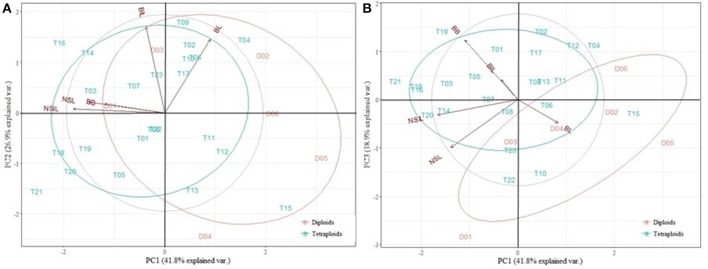
Figure 7.
Principal Component Analysis (PCA) of the diploids (D) and tetraploids (T) of Escallonia illinita. 3 PCs with an eigenvalue larger than 1 explained 87.6% of the variance presence. (A) PC1 vs. PC2, explaining 68.7% of the variance. (B) PC1 vs. PC3, explaining 30.7% of the variance. NSL, new shoot length; NSIL, new shoot internode length; BB, budburst; BL, branch length; BIL, branch internode length.

