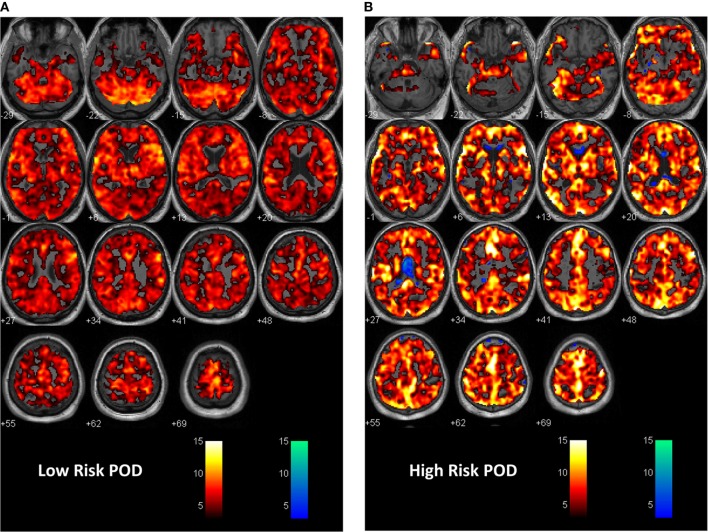
Figure 2.
First level analysis with statistical parametric mapping (SPM) showing response to the CO2 stress test in (A) a patient at low risk for postoperative delirium (POD). In this instance, the expected response to the CO2 stimulus as recorded during BOLD imaging is shown. A vigorous response to CO2 is evident from the hot voxel response—shades of orange. The response at the p = 0.001 level occurred in 84% of whole brain parenchyma. The numbers below each image are the distance in millimeters above or below the anterior–posterior commissure. This patient had a non-POD outcome. The color bar is the t-value for fit to the general linear model from the SPM analysis. Voxels are colored if the t-value exceeded 3.11 in this instance. (B) A patient at risk of POD. Here, there is less response to the hypercapnic signal—a 64% response to hypercapnia and now an inverse or intracranial steal signal shown in cold voxels—shades of blue. The inverse voxel count was 4.3% of the total count. This patient had a subthreshold POD outcome. See Ref. (25) for a fuller description of the methodology.

