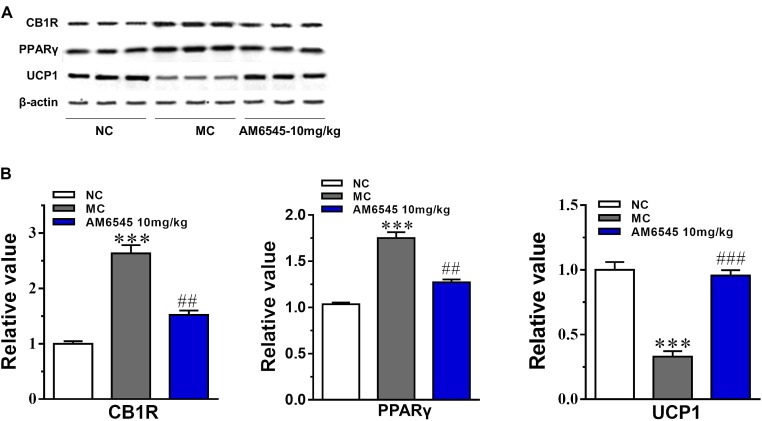
FIGURE 6.
Effect of AM6545 on protein expression in intraperitoneal adipose tissue of the MSG mice. (A) The protein expression of CB1R, PPARγ, and UCP1 analyzed by Western blot assay. (B) Quantification of the results in (A). Results are normalized to β-actin in the correspondent group, and expressed as relative expression compared with that in NC group. NC, normal control; MC, model control; values are mean ± SEM, n = 3; ∗∗∗p < 0.001 versus NC group; ##p < 0.01, ###p < 0.001 versus MC group.

