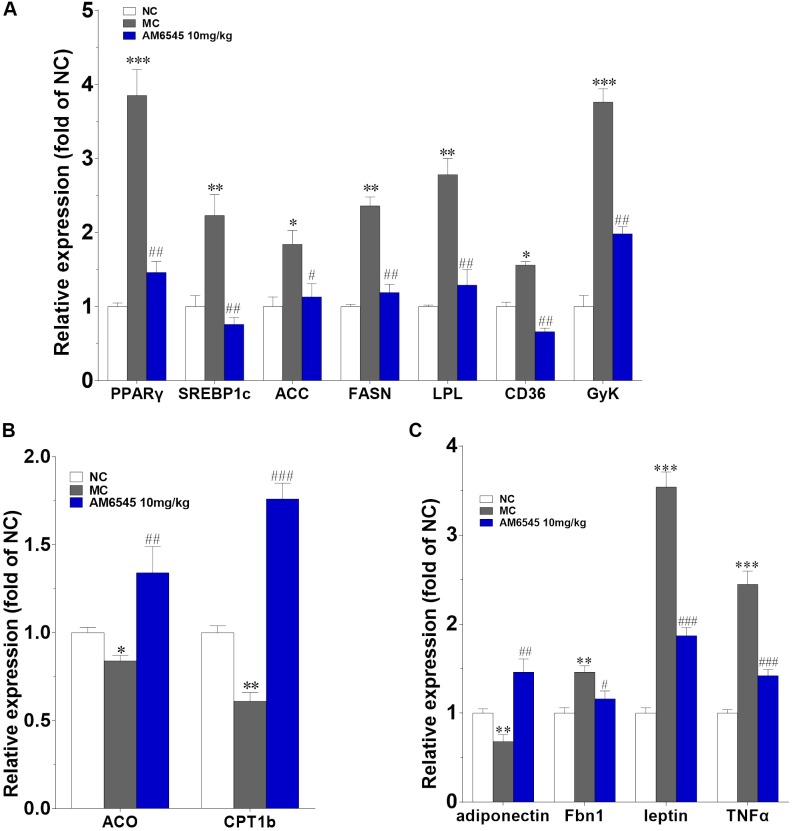
FIGURE 7.
Effect of AM6545 on gene expression in intraperitoneal adipose tissue of the MSG mice. The gene expression of lipogenesis (A), lipolysis (B), and adipokines (C). Results are normalized to β-actin and expressed as mean fold increase of mRNA ± SEM compared with NC group. NC, normal control; MC, model control; n = 3; ∗p < 0.05, ∗∗p < 0.01, ∗∗∗p < 0.001 versus NC group; #p < 0.05, ##p < 0.01, ###p < 0.001 versus MC group.

