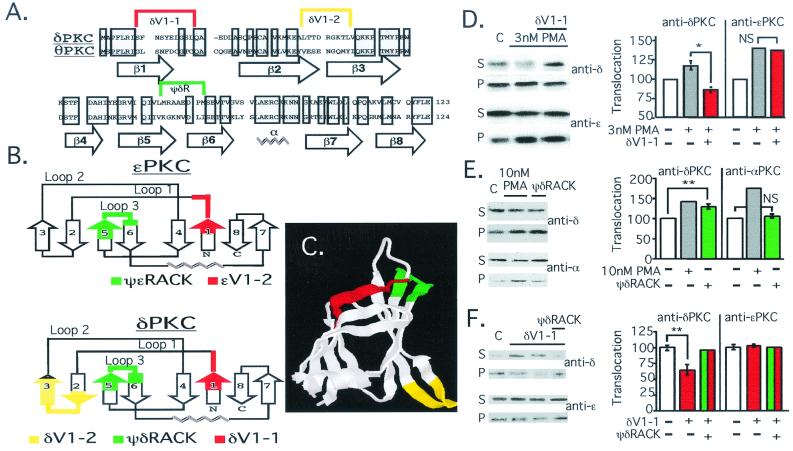
Figure 1.
Rational design of δPKC translocation inhibitor and activator. (A) Alignment of the primary sequence of rat δPKC and mouse θPKC V1 domains (Protein Data Bank accession nos. KIRTCD and NP_032885, respectively); shadowed boxes indicate identity. Location of β-strands and the α-helix based on δV1 structure analysis (26) are indicated below the sequence; sequences most different between the two isozymes are marked above with a color bracket. (B) The secondary structure of δV1 (26) (Lower) and a modeled secondary structure of ɛV1 (G.C., D.M.-R., and L.B., unpublished work; Upper) are schematically depicted, according to ref. 32. Numbering of β-strands in δV1 and ɛV1 domains are marked as in A for δV1. The sequence corresponding to δV1–1, amino acids 8–17 [SFNSYELGSL], δV1–2, amino acids 35–45 [ALTTDRGKTLV], and ψδRACK, amino acids 74–81 [MRAAEDPM], are marked as in A, in red, yellow, and green, respectively. The sequence corresponding to the ɛPKC-selective inhibitor peptide, ɛV1–2, amino acids 14–21 [EAVSLKPT] (12), and activator peptide, ψɛRACK, amino acids 85–92 [HDAPIGYD] (13), are marked in red and green, respectively (Upper). (C) Crystal structure of the δV1 domain (Protein Data Bank ID no. 1BDY; ref. 26) is depicted with areas marked in colors corresponding to those in A and B. (D) Western blot analysis of cytosolic and particulate fractions from adult rat cardiac myocytes was carried out as described (13) to demonstrate isozyme-selective effects on δPKC translocation. Cells were treated with PMA in the presence and absence of δV1–1. (Left) Autoradiogram of soluble (S) and particulate (P) fractions probed with anti-δPKC (Upper) and the same blot probed with anti-ɛPKC antibodies (Lower). (Right) Mean ± SEM of data from three experiments; translocation is expressed as the amount of each isozyme in the particulate fraction over the amount of that isozyme in nontreated cells. *, P < 0.05; NS, not significant; n = 3. (E) Same as in D, except cells were treated with PMA or ψδRACK and translocation of δPKC and αPKC is shown. **, P < 0.01. (F) Same as D, except cells were treated with δV1–1 in the presence and absence of ψδRACK. **, P < 0.01.

