
FIGURE 5.
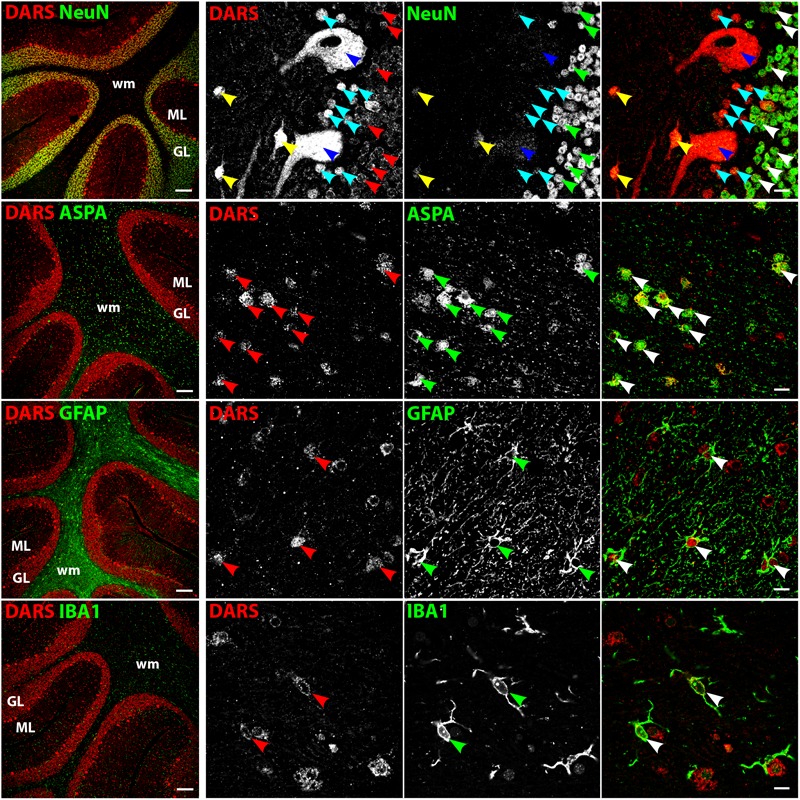
Cell type-specific DARS expression in the cerebellum. Immunofluorescence of DARS (red) and the cell type-specific markers (green) NeuN (neurons), ASPA (oligodendrocytes), GFAP (astrocytes), and IBA1 (microglia). Left panel shows low power magnification of the granular layer (GL), molecular layer (ML), and white matter (wm) (scale bar: 200 μm). Right panel displays high power images including separate channels to illustrate cell type-specific as well as subcellular DARS localization (scale bar: 10 μm). Red, green, and white arrowheads mark cells positive for DARS and the cell type marker. Blue arrowheads highlight Purkinje cells, turquoise arrowheads Bergmann glia, and yellow arrowheads basket cells.