
FIGURE 6.
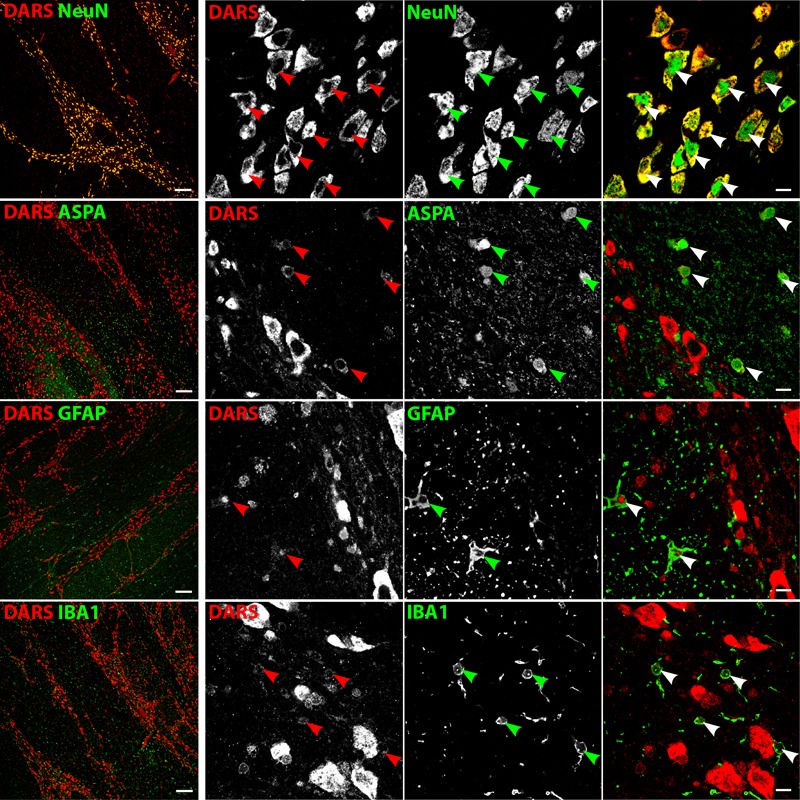
Cell type-specific DARS expression in the brainstem (pons). Immunofluorescence of DARS (red) and the cell type-specific markers (green) NeuN (neurons), ASPA (oligodendrocytes), GFAP (astrocytes), and IBA1 (microglia). Left panel shows low power magnification of the gray and white matter of the pons (scale bar: 200 μm). Right panel displays high power images including separate channels to illustrate cell type-specific as well as subcellular DARS localization (scale bar: 10 μm). Arrowheads indicate DARS-positive cells.