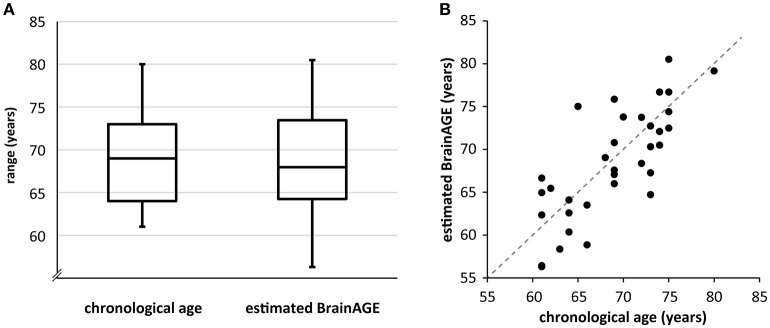
Figure 2.
(A) Boxplot of CA and estimated BrainAGE across the sample. The BrainAGE score was added to CA for immediate comparability. The line within the boxes represents the median, the outer lines of the boxes depict the first and the third quartile, respectively. The error bars reach from the first and third quartile to the respective extrema. Note that estimated BrainAGE shows higher variability than CA as well as a trend toward lower values. (B) Scatterplot of CA and estimated BrainAGE. The angle bisector represents the line where CA equals estimated BrainAGE. Please note that the data point that is situated directly on the angle bisector belongs to a participant with a positive BrainAGE of 0.09.

