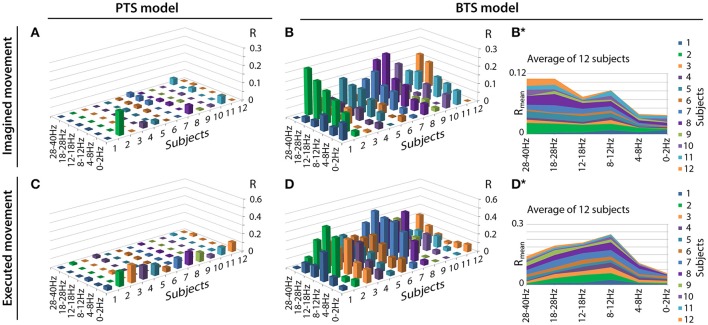
Figure 6.
Motion trajectory prediction accuracy using different models. Each displayed accuracy value is an average value based on the results of four runs, six outer folds, and three velocity components. Decoding accuracy values of imagined arm movements are presented in (A) for the band-pass filtered potential based PTS model and (B) for the PSD based BTS model. Reconstruction accuracy of executed arm movements is presented in (C) for the band-pass filtered potential based PTS model and (D) for the PSD based BTS model. For the BTS model, the cross-subject average of the reconstruction accuracy is presented in (B*) for imagined and in (D*) for executed movements (similar comparison of cross-subject mean values for the PTS results is not presented in this Figure as panels (A) and (C) show that the low delta band (0–2 Hz) is the dominant band for each subject for the PTS model).

