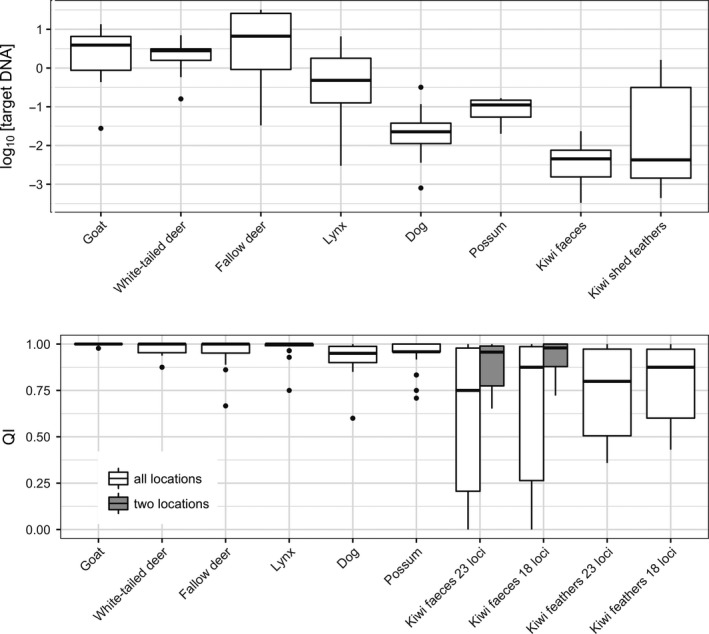
Figure 5.

Log10‐transformed target DNA concentration (measured in ng/μl) and quality index results for kiwi feces and shed feather samples compared with six mammalian species from (Ramón‐Laca et al., 2015). QI scores range from 0 to 1, where 1 indicates complete agreement between all replicates
