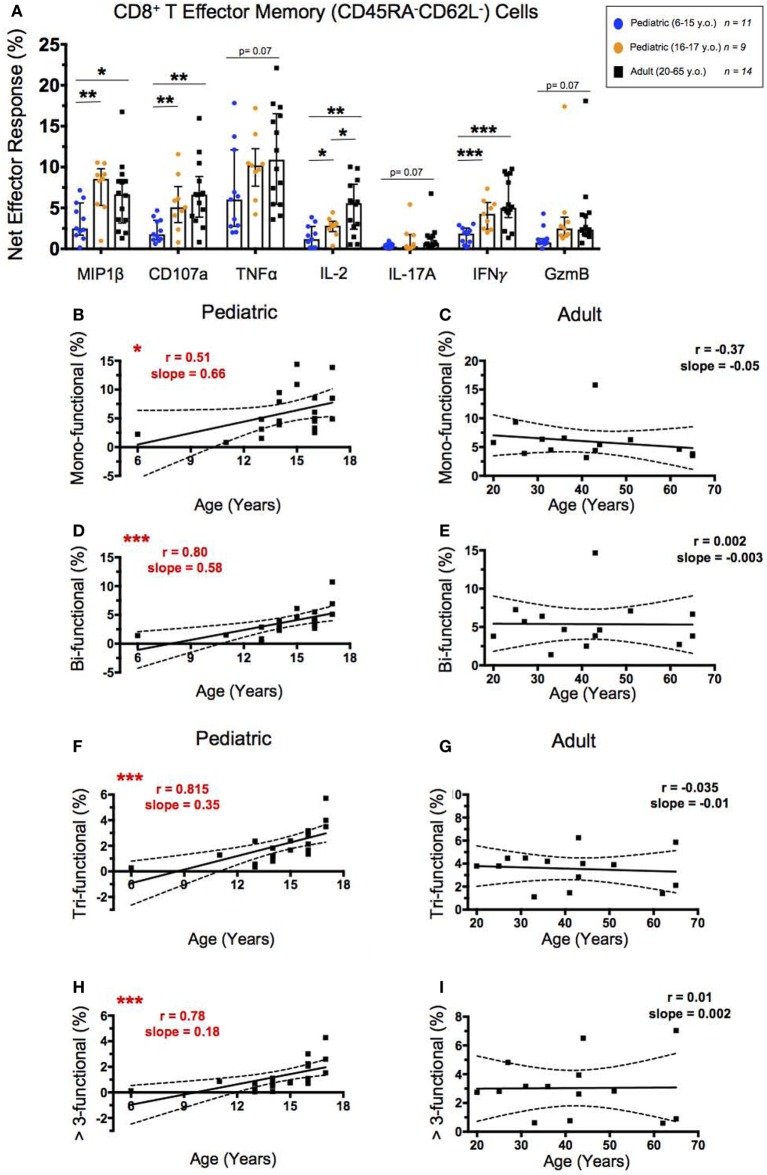
Figure 4.
CD8+ T effector memory response. (A) Scatter plot showing the net percentages of CD8+ TEM producing MIP-1β, CD107a, TNF-α, IL-2, IL-17A, IFN-γ, and Granzyme B (GzmB) following SEB stimulation. Results are shown for the following populations: 6–15-year-old pediatric (n = 11), 16–17-year-old pediatric (n = 9), and adult (n = 14) participants. Bars represent medians with whiskers indicating interquartile ranges. Scatter plot statistics were analyzed by unpaired t-test (*p < 0.05; **p < 0.01; ***p < 0.001). Line graphs represent linear regression with 95% confidence intervals among CD8+ T effector memory cell mono- (B,C), bi- (D,E), tri- (F,G), and >3- (H,I) functional populations following SEB stimulation within participants between the ages of 6–17 (n = 20) and 20–65 (n = 14) years old. Line graph statistics were analyzed by Spearman r correlation (*p < 0.05; ***p < 0.001).

