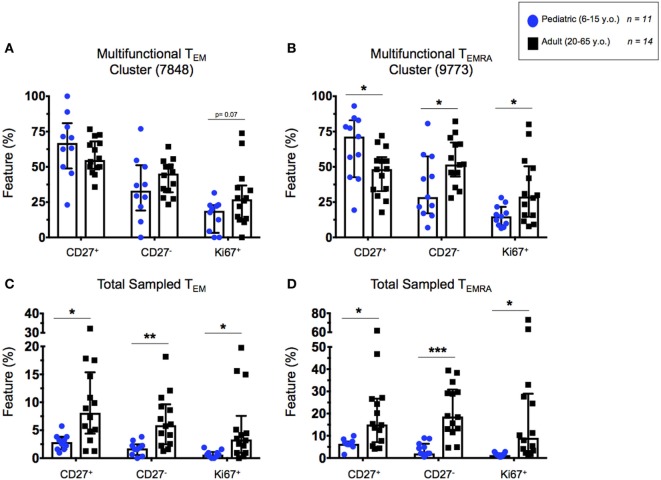
Figure 7.
Highly multifunctional CD8+ T cell functional states. Scatter plots showing the percentages of highly multifunctional CD8+ T cells as defined by CITRUS node isolation. (A) TEM and (B) TEMRA cells within the chosen highly multifunctional nodes (see Figure 6) showing proportions of cytotoxic (CD27−) or proliferative (CD27+ and Ki67+) multifunctional CD8+ T cells in adults and children. (C) TEM and (D) TEMRA populations showing highly multifunctional CD27+. CD27−, and Ki67+ cells from within the total CITRUS sampled CD8+ memory T cell subsets, exhibiting the proportion of highly multifunctional cytotoxic or proliferative phenotypes from within the each memory subset. Populations split among 6–15-year-old pediatric (n = 11) and adult (n = 14) participants. Bars represent medians with whiskers indicating interquartile ranges. Scatter plot statistics were analyzed by unpaired t-test (*p < 0.05; **p < 0.01; and ***p < 0.001).

