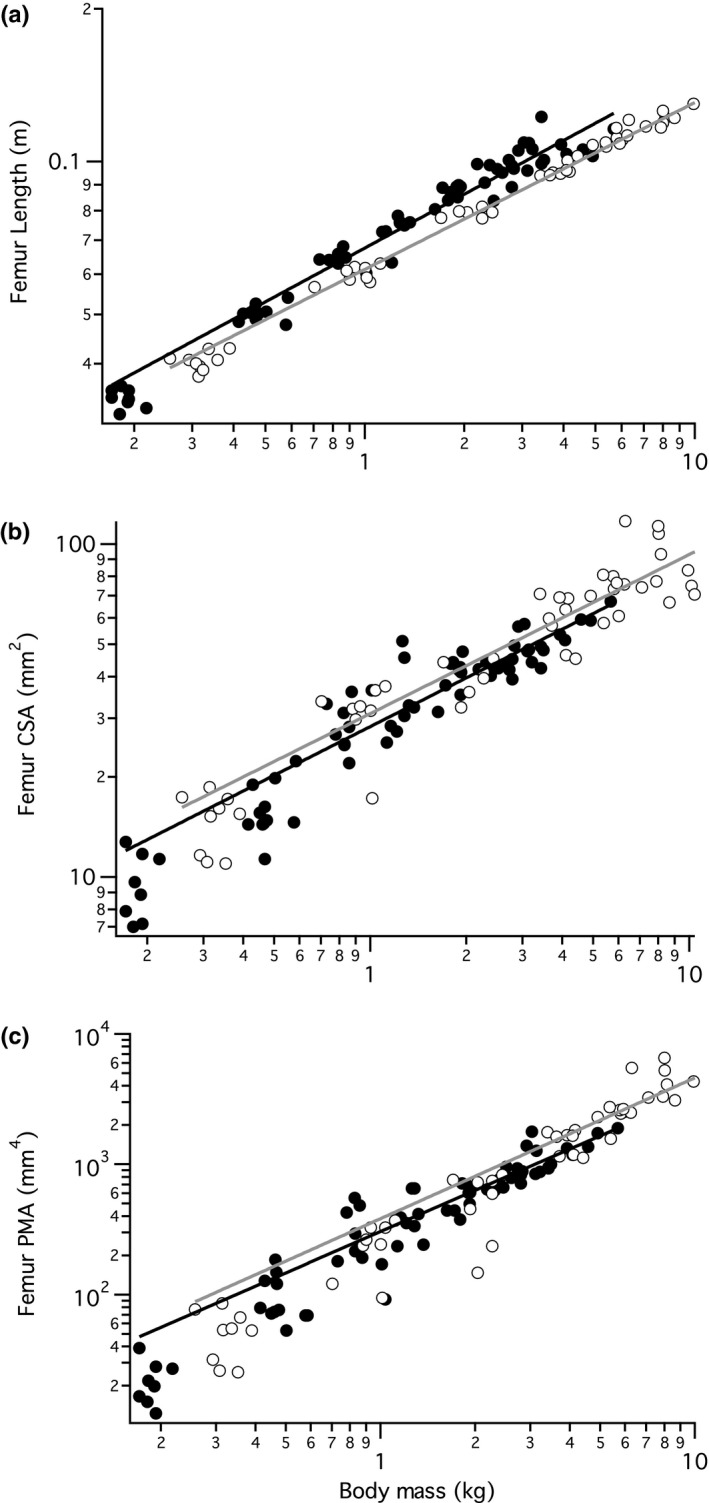
Figure 3.

Scaling of the femur relative to body mass, from in vivo CT scans taken every 2 weeks for 14 weeks. (a) The length of the femur for wild (closed circles, black regression line) and domestic (open circles, gray regression line) turkeys across body mass. The scaling factor (slope) for the wild turkeys is M0.38, which is statistically significantly higher than the domestic scaling factor M0.34 (statistical results in Table 1). (b) Cross‐sectional area for the femur (mid‐shaft) across body mass, with non‐significantly different scaling factors of M0.61 and M0.55, respectively. (c) The polar moment of area for the femur, with non‐significantly different scaling factors of M1.38 and M1.39, respectively. The tibiotarsus and tarsometatarsus have similar scaling relationships (Table 1). All data are plotted on logarithmic axes
