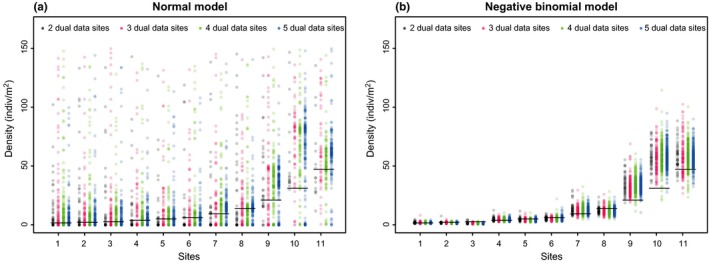
Figure 2.

Results of the cross‐validation study from the common carp dataset (mesocosm experiment). Each point represents the density estimate obtained from (a) the Normal model and (b) the Negative Binomial model, for cases where fish density was known for 2 (black), 3 (red), 4 (green), or 5 (blue) sites (i.e., dual data sites). The horizontal black dashes represent the known values of animal density
