. 2018;26(1):19–23. doi: 10.5455/aim.2018.26.19-23
© 2018 Reza Safdari, Hadi Kazemi Arpanahi, Mostafa Langarizadeh, Marjan Ghazisaiedi, Hossein Dargahi, Kazem Zendehdel
This is an Open Access article distributed under the terms of the Creative Commons Attribution Non-Commercial License (http://creativecommons.org/licenses/by-nc/4.0/) which permits unrestricted non-commercial use, distribution, and reproduction in any medium, provided the original work is properly cited.
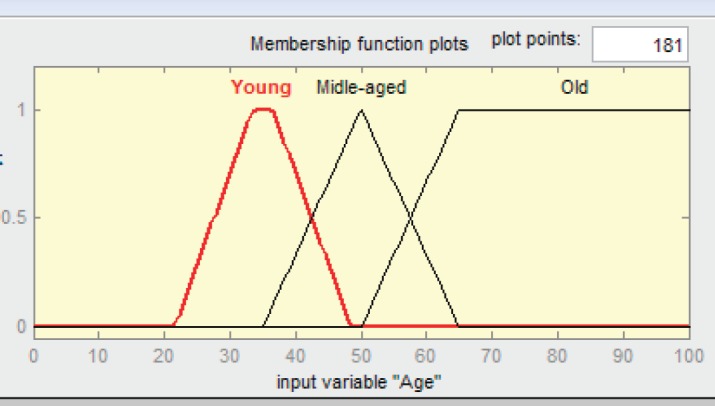
Figure 2. Membership function plot for input variable AGE.