
Figure 2. Fragment screening methods.
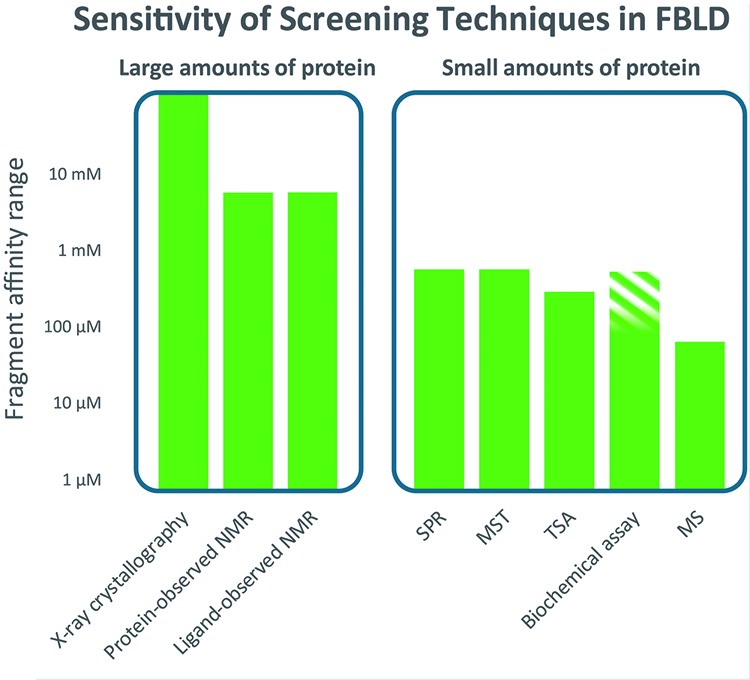
The figure emphasizes that there are two main categories of fragment screening methods – those that require many mg (10s of mg for NMR) of protein and those that require small amounts (typically less than 1 mg can be sufficient). The following is a brief description of the main characteristics and limitations of each of the methods. For all methods, it is important to appreciate the sensitivity of detection (indicated on the vertical axis of the diagram) and the solubility required of the fragment. For some methods, such as NMR, a robust indication of binding can be observed at fragment concentrations around or below the KD; for others, such as X-ray, surface plasmon resonance (SPR) and microscale thermophoresis (MST), it is necessary to achieve a concentration 5–10 times the KD for a robust binding signal. X-ray crystallography – the main requirement is for the protein to form crystals suitable for soaking with high concentrations of fragment (robust crystals with an open binding site not occluded by crystal packing and where any conformational changes on binding can be accommodated within the crystal). Typically, fragments are soaked at 10s mM concentration, usually in mixtures chosen on shape diversity. Advances in synchrotron facilities (in particular Pilates detectors) and streamlining of structure solution software [28] allow many hundreds of crystal structures to be determined in a few weeks – with recent automation (at synchrotrons such as the Diamond facility in Harwell, U.K.) increasing throughput to thousands of structures in a week [29]. The main advantage is that the structure of the fragment bound to the protein is available immediately; as well as the need for a suitable crystal system, the main disadvantage is that it can sometimes take a number of attempts to obtain crystal structures of compounds bound to a protein [26], so there will be false negatives. Protein-observed NMR – the main requirement is for large quantities of labelled protein (usually with 15N, sometimes with 13C), which can only routinely be produced with bacterial overexpression and which is soluble at approximately 100 µM in a suitable buffer (low-salt). The predominant experiment for screening is heteronuclear single quantum correlation spectroscopy (HSQC), which generates a 2D NMR spectrum where each peak (for 15N-labelled) represents each amide – where the chemical shift reports on the local environment that changes on binding of a fragment. It is possible to titrate the fragment to estimate KD and the pattern of peaks can be used to check for same site binding. If the spectrum is assigned then the binding site can be mapped. The method can measure from very strong binding down to mM when the ligands are sufficiently soluble. The main limitations are the time it can take to measure HSQC spectra (10 s of minutes each) for a large fragment library and a size limit on the protein (usually 30 kDa as higher MW gives slower tumbling and broadening of NMR peaks). Ligand-observed NMR – the main requirement is for large quantities of protein (usually 10s of mg, labelling not required, protein can be of any size) that is soluble at approximately 10 µM in a suitable buffer and stable for the time required for screening (with automation, this can be a few days for a full library screen). Practices vary, but what is recommended [5] is to use three different 1D experiments – saturation transfer difference (STD), water-ligand-observed gradient spectroscopy (LOGSY) and Carr–Purcell–Meiboom–Gill sequence (CPMG), and to include a competition step. The NMR experiments report on different properties of the fragments when they bind. For STD, this is transfer of resonance energy from the protein to the fragment when it binds; for water-LOGSY, this is the differential transfer of energy from solvent to the fragment and for CPMG, measuring the difference in relaxation time for the fragment free in solution or binding to the protein. Typically, fragments are screened in mixtures of 4–10 fragments – with a check that there is at least one distinctive peak for each fragment in the combined 1D spectra. As long as none of the fragments is very potent (thus blocking the binding site), then the experiment will report if multiple fragments from a mixture bind. It is beneficial to include a competition step where a known ligand is added to the protein fragment sample – to differentiate between specific and non-specific binding (which can be an issue at the high concentrations, typically 500 µM, used). The main limitation is the amount of protein required – typically 40–50 mg to screen a library of 1200 fragments. The sensitivity is from 100 nM to 5mM, although at stronger binding affinities the requirement for fast binding kinetics is not always fulfilled, leading to false negatives. BU – in this method, the protein is attached to a surface (a variety of methods – either non-specifically e.g. via free amines, or specifically – through a terminal his-tag [30] or introduced biotin tag). The refractive index of the surface varies with the MW of what is attached (see the lower left panel in ‘part 4’ of Figure 1) – there is a rise in MW as the fragment binds and a fall when the fragment is no longer flowing (for larger compounds, SPR can provide very useful kinetics of binding – kon and koff). The sensitivity is to approximately 500 µM affinity – limited by solubility. The main advantage of the method is the small amount of protein required – the main disadvantage is that it can be a challenge to immobilize the protein on the surface and retain binding integrity – some experience is required (and a tool compound) to assess for correct behaviour. In SPR, the protein sample is immobilized and the surface must be washed after each binding experiment. Thus, SPR is more sensitive to compounds inducing aggregation or having slow kinetics. MST – this method works on the principle that the speed at which a molecule moves in a temperature gradient is related to its hydration sphere, electrostatic surface and weight, which are affected by compound binding. The temperature gradient is induced by an infrared laser; movement is detected from a fluorophore (usually added) on the protein. This is a relatively new technique and experience (and suitable controls) is still growing in the community outside the equipment manufacturers [31]. The challenge is to introduce a suitable fluorophore that does not perturb the interaction being measured and success varies with different targets. If successful, the method is rapid and uses small amounts of protein. Thermal shift analysis – it is also known as differential scanning fluorimetry. In this method, fragment binding is detected from changes to the thermal stability (melting temperature or Tm) of the protein – measured by detecting binding of a fluorescent dye to the protein as it unfolds when heated. The advantage is that quite small amounts of materials are needed and that inexpensive thermal cycling instruments (such as for PCR) can be used. The challenge is that small fragments, at best, introduce only a small change to the stability of the protein at the usual Tm values (50–70°C) and so there are a lot of false negatives [32]. However, it is very attractive for academic groups and will usually find some fragments that bind. Biochemical assay – some assay formats (both binding and functional) will withstand the high concentrations that are used in fragment screening, but there can be challenges with interference if detection is spectrophotometric or fluorometric. Sometimes, the assay will successfully report on fragment binding or activity, sometimes not [26]. This is the reason the higher concentration section is marked shaded. Mass spectrometry (MS) – the main challenge with MS for detection of protein–ligand binding is finding suitable conditions to maintain binding in the gas phase – this is particularly challenging for the weak binding of fragments and although a few reports have appeared [33], the method is a challenge for fragments with 100 µM or so the upper limit of sensitivity. One imaginative recent idea is to mix the fragments with the protein, remove the free fragments, liberate the bound fragments and identify them with MS [34].