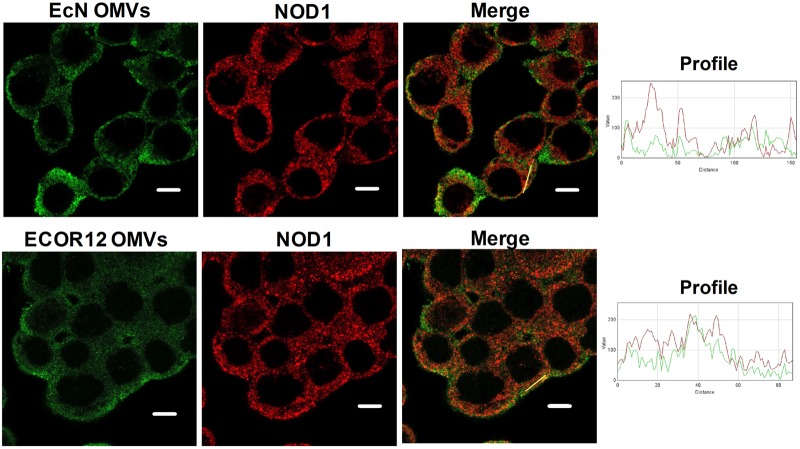
FIGURE 5.
NOD1 colocalizes with EcN and ECOR12 OMVs. HT-29 cells were incubated with EcN or ECOR12 OMVs (10 μg) for 1 h and analyzed using laser scanning confocal spectral microscope. NOD1 was stained using anti-NOD1 polyclonal antibody and Alexa Fluor 633-conjugated goat anti-rabbit IgG (red). OMVs were stained using anti-Escherichia coli LPS mouse monoclonal antibody followed by Alexa Fluor 488-conjugated goat anti-mouse IgG (green). Images are representative of three independent biological experiments. Colocalization of the red and green signals was confirmed by histogram analysis of the fluorescence intensities along the yellow lines. Analysis was performed by laser scanning confocal spectral microscope with 63x oil immersion objective lens, and images were captured with a Nikon color camera (8 bit). Scale bar: 10 μm.

