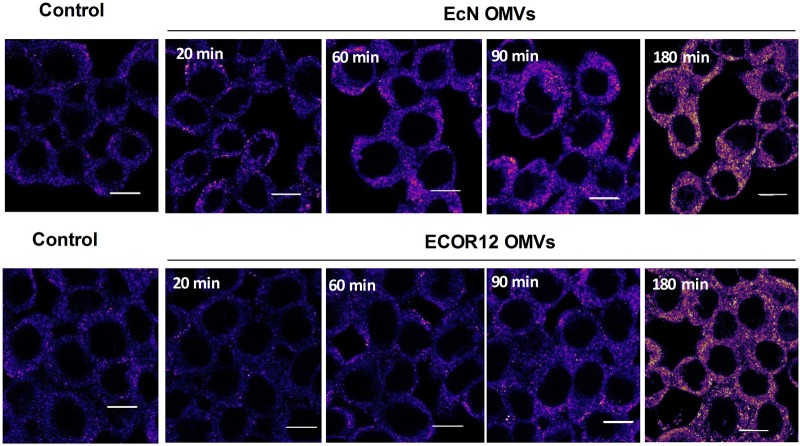
FIGURE 6.
Time-course analysis of NOD1 aggregation pattern in HT-29 cells in response to EcN or ECOR12 OMVs. HT-29 cells were incubated with EcN or ECOR12 OMVs (10 μg) for the indicated times and analyzed using laser scanning confocal spectral microscope. NOD1 was stained using anti-NOD1 polyclonal antibody and Alexa Fluor 633-conjugated goat anti-rabbit IgG. Images are representative of three independent biological experiments and are presented in color-code Fire. Analysis was performed as described for Figure 5. Scale bar: 10 μm.

