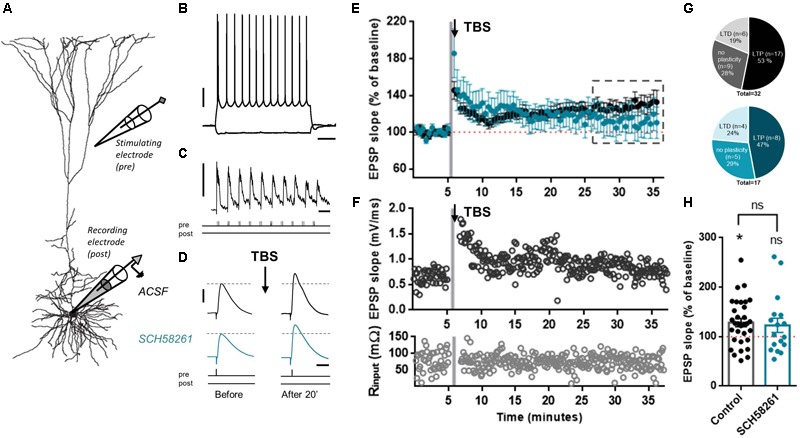
FIGURE 3.

A2AR blockade does not affect glutamatergic synapse LTP in layer 5 pyramidal neurons. (A) Biocytin reconstruction of layer 5 pyramidal neuron from coronal slice of rat prelimbic mPFC showing relative positions of recording and stimulating electrodes. (B) Voltage responses to hyperpolarizing (–60 pA) and depolarizing (+380 pA) somatic current injections to the soma of a L5 pyramidal neuron. Scale bars: 20 mV, 200 ms. (C) Plasticity induction protocol. Theta burst stimulation (TBS) was induced by stimulation of 10 bursts of five pulses each at 100 Hz, repeated three times. Scale bars: 20 mV, 200 ms. (D) After obtaining a baseline measure of EPSPs, TBS-LTP was induced. EPSPs were then recorded for up to 30 min to observe changes in EPSP slope. Slices were pre-incubated in either control ACSF or in ACSF with added SCH58261 (100 nM). Scale bars: 2 mV, 20 ms. (E) Summary time-course plot of control (black symbols) and SCH58261 (100 nM; blue symbols) experiments, showing a robust LTP in control condition, and a highly variable LTP in SCH58261 pre-incubated cells. (F) Example of a TBS-LTP experiment in control conditions showing slope and input resistance (top and bottom panels, respectively) versus time. Gray shading indicates time of TBS induction. (G) The fraction of cells that display LTP is slightly higher in the control condition than in the presence of SCH58261; however, fraction differences were not significant (Chi-square test, p = 0.52). (H) Summary bar chart of control and SCH58261 (100 nM) TBS-LTP experiments, showing percentage change of EPSP slope for both conditions (mean ± SEM; control: n = 32, SCH58261: n = 17). Unpaired t-test p = 0.73; ∗p < 0.05 compared to baseline value of 100%, one-sample t-test.
